|
|
< Day Day Up > |
|
Using Databases and Web Servers to Manage Your Security DataGoing beyond just checking server logs, you also want to be able to analyze the output of the security programs discussed earlier in this book. The best way to do this is to import the results into a database. The rest of the tools in this chapter are designed to let you import and view security data in a database. To use these tools you'll need a database program and a Web server running to review the results. Though there are other options supported, the database recommended for these programs is MySQL and the Web server is Apache with PHP. You should set up these programs before attempting to install any of these tools. The basic installation and configuration of each of these prerequisite servers are described briefly here. Setting Up a MySQL ServerMySQL is an open source SQL-compliant database that is gaining acceptance in the corporate world for its power and flexibility. While this book does not intend to teach you all the ins and outs of running a MySQL database, the following information will help you set up and execute some basic administrative tasks on a MySQL database so you can use the analysis tools.
MySQL is now ready to use. Type mysql at a command prompt and you will be prompted for a user name and password to enter the standard MySQL command line, where you can use standard SQL commands on your MySQL databases. See the sidebar for some basic MySQL commands.
Setting Up the Apache Web ServerThe advanced analysis tools in this chapter require a Web server to act as both the configuration interface and the output mechanism. Again, this short section is not intended to be a comprehensive guide on how to run and operate a Web server; it is merely intended to get you up and running with what you need to use the security tools. If you intend to do use this server for more than ACID and NCC or to use it in high-volume environments, you should definitely do further reading on Web server administration. Running a Web server does involve some security issues, and you should make sure these servers are locked down, running minimal services, and keep them frequently patched. If you want to run IIS or an alternate Web server, it should work as long as it is compliant with PHP 4.0 or later.
Again, this isn't a comprehensive coverage of Web server security, but make sure you do these things before making your server public. Setting Up PHPPHP is a scripting language designed for use in Web pages. It is an interpreted language, which means it doesn't have to be compiled to work, so you can just insert your PHP script into a directory that recognizes PHP and it will run when accessed. This makes it easy to write code embedded into Web pages. Most current Web servers recognize PHP, though it may have to be configured on installation to do this. Because of these features, PHP has become the language of choice for many Web-based applications. You will need it for the three remaining tools in this chapter (ACID, NPI, and NCC). PHP should have been installed as part of the configure directives in the Apache instructions described earlier. To check if PHP is installed on your system and what version it is, type php v at the command line. If it is there, you should get some output with the version number. However, if you were unable to install it as part of your Apache installation or you want to reload the latest version, use the following procedure.
The Analysis Console for Intrusion Databases (ACID) is a program designed to make better use of data from intrusion detection devices. It was written by Roman Danyliw and others for the AirCERT program run by Carnegie Mellon University. They are part of the larger CERT (Computer Emergency Response Team) organization. CERT has been instrumental in protecting the Internet and the organizations using it for many years. CERT tracks incidents of computer crime and sends out notices to a mailing list whenever a large incident happens. The CERT mailing list is kind of an early warning system for any large outbreaks or attacks happening on the Internet. As such, it can be very useful to a system administrator. You can visit the CERT site and sign up for their mailing list at www.cert.org. The AirCERT project is placing IDS sensors at various organizations and studying overall trends in intrusion activity and behavior. They wrote ACID to facilitate this process. Because they open sourced the code for the project, you can use it for your benefit without doing anything as part of AirCERT. The idea behind ACID is to port all your intrusion detection data into a database where it can be sorted and organized by priority. ACID gives you a Web-based control panel of sorts to view and manipulate these results. ACID uses just about any SQL database and any Web server, and supports multiple sensors for the input data. It also accepts both raw Snort alerts and syslog-compliant log files. ACID currently only works directly with one IDS, Snort, but you can import logs into the ACID database from any device that will output in a syslog-type format using a utility called Logsnorter, which is available on the ACID Web site. ACID has quite a few prerequisite programs. Besides a database, a Web server, and PHP, which have been covered earlier in this chapter, you need the following libraries and subprograms. ADOdbThis package provides the database abstraction layer so PHP can use a standard interface to a multitude of databases, including MySQL. Download it from http://php.weblogs.com/adodb, unpack it into your /www/htdocs or applicable Web root directory, and it should be ready to go. No further installation is needed. PHPLOTThis package lets you create charts using ACID. If you want to use this capability, download the module from www.phplot.com. Unpack it in the /www/htdocs directory, and just like ADOdb, it should be ready to use. JpGraphThis program upgrades PHP to do color graphs. You'll need it, along with PHPLOT above, if you want to be able to graph your Snort data. Download it from www.aditus.nu/jpgraph/ and unzip it into your Web root directory (for example, /www/htdocs). It will create its own subdirectory and be available when needed by ACID. GDThis package has the image manipulation libraries for PHP, which are also needed for graphing. If you installed PHP according to the instructions given earlier in this chapter, then you should already have this utility. Otherwise, download it from www.boutell.com/gd/ and install it in your /www/php directory. If you didn't compile PHP with the commands given earlier, you also need to make sure you have the following libraries for GD.
Configuring Snort for MySQL
This chapter assumes you will be installing ACID on a separate machine from your Snort sensor. Putting them on the same machine is not only a bad idea from a security standpoint, but will also bog down your Snort sensor to the point of making it unusable. The box running ACID should preferably be located at a separate site from the Snort sensorsthis makes it harder for someone who hacks a Snort sensor to get to your logs. Figure 8.1 illustrates the elements of an ACID-Snort IDS. Figure 8.1. ACID-Snort Intrusion Detection System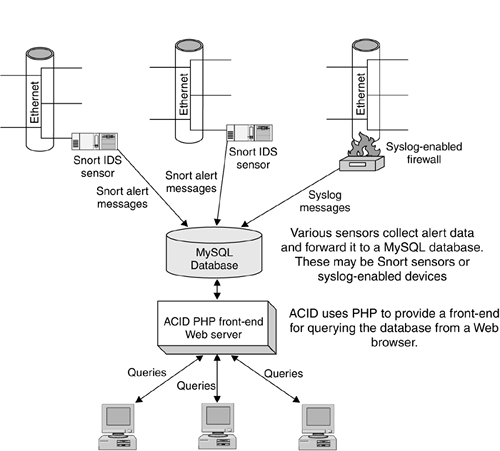 Installing ACIDOnce you have all the prerequisite programs loaded, you can finally install ACID.
Configuring ACID
You have now finished configuring ACID and can start using it to manage your IDS systems. Introduction to Using ACIDWhen you first log in, the ACID main page displays (see Figure 8.2). The top area of the main database view gives you overall statistics on the database you are viewing, including its name, the time frame of all the records contained in the database, and the date and time last queried. The section below that has all the summary information on this particular alert group (AG). The AG is the sensor or group of sensors represented in this database. If you want to track different groups of sensors as an entity, such as for different customers or divisions, you need to create a separate database or AG for each one. This is also important when you are running reports and using the archival capabilities of ACID. You can only take search or query actions on an individual AG, not on multiple AGs, so make sure that your sensors are properly organized into distinct AGs. For most companies, it will be sufficient to have just one AG with all your sensors in it. But if you are a consulting company or have large operations with multiple divisions, you may want to put groups of sensors into different AGs so you can track them separately. In the box on the left of the screen you can see the statistics on this AG: the total number of alerts, the number of unique alerts, and the number of different IP addresses appearing in the database, both by source IP and destination IP. If you have multiple sensors in your ACID network, you can click on the Sensors item to see them listed. You can narrow your search criteria down to the data from just one sensor. This main page also profiles your alert traffic graphically by each protocol and port scan traffic so you can get a flavor for what kind of traffic is being scanned by your NIDS sensor. Using ACID to Tune and Manage Your NIDSBefore your NIDS can be useful at all, you must tune it to your network to eliminate false positive alerts. ACID can be invaluable in this effort. When you first turn on your NIDS, all of the alert signatures will be active and your database will begin to fill up with alert activity. Most of these alerts are going to be false positives at first. To make the alert data relevant to your network, you need to begin removing some of these signatures to eliminate much of the erroneous activity and to give you only data that is actionable. Once you have a sufficient number of alerts in the database (at least a thousand on a busy network), you can start analyzing your alert data and eliminating some alert types. Watch your database carefully, as it may not take very long at all for it to fill up, especially with the default Snort rule list. Open ACID and click on the Unique Alerts button. This shows the most recent alerts categorized by alert type (see Figure 8.3). Figure 8.3. Most Recent Unique Alerts Listing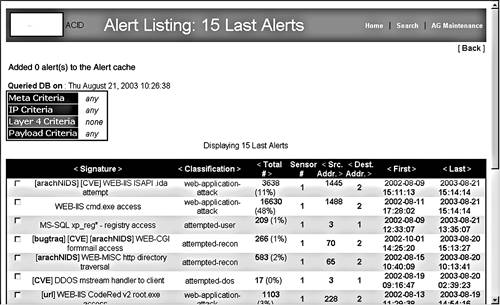 On this page, you see the following information on each alert type:
You can sort any of the columns by clicking on the little arrows at the top of the column. For example, you can sort by the number of alerts, then click on the largest offender. This narrows down the list to only that alert type. Scan the list and see if you can determine if this is really a security issue or a false positive. Are there any discernable patterns? Are they all coming from the same IP address? Are they all going to the same IP address? Are they happening at regular intervals or do they seem random? If this analysis doesn't lead to any conclusions, drill deeper by clicking on individual alerts. This lets you see the actual packet that set off the alert, and is very helpful from a forensic standpoint if you are actually being attacked and are trying to respond or pursue the attackers further. Also, be forewarned: If sensitive data is crossing your network, you may inadvertently end up viewing it since you are capturing whole packets of data in the alerts. Make sure you are cleared to see this kind of data. It is also very important that your Snort database is properly secured, because anyone who breaks into your database machine would potentially have access to that sensitive information. Another solution to this is to turn down the level of detail captured in the alerts, though this may hinder your ability to use the alerts to track down the culprit. In the example in Figure 8.3, Web-IIS cmd.exe is the most common alert. By clicking on the alert detail, you can see the actual packet that generated this alert (see Figure 8.4). The source IP is shown, along with all the TCP ports and settings. Figure 8.4. ACID Alert Detail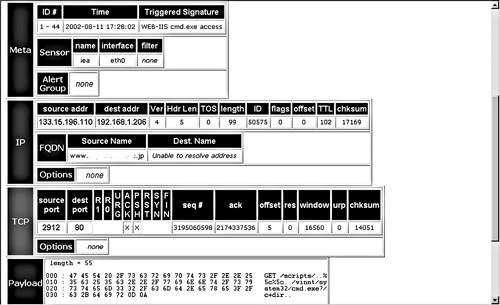 Based on the host name, this packet came from an address in Japan (upper-level domain of .jp). You can use this to determine whether this is an address that should normally be accessing your network. You can also look lower and see the actual packet payload. The left side has the packet data in hexadecimal and the right side converts it to ASCII (if it is possible to display that way). This shows the actual commands the sender was trying to issue against your machine. From looking at these, it seems someone was trying to access the cmd.exe command; in other words, get a command line prompt. This is clearly an attack on your system. Unfortunately, this is probably a scripted attack done by an Internet worm, and these types of attacks happen dozens of times a day, as you can see from the large number of cmd.exe alerts in the database. Still, it's worth keeping an eye on, to see if that IP comes up consistently. You can at least file a complaint with the ISP and make sure the destination machine being attacked is secure against that exploit. You could also take further action against the IP address listed as the source, such as legal prosecution or civil action, if a successful break-in had occurred. At least you now know exactly what kinds of attacks are coming at your network and what they are trying to do. This will better enable you to proactively protect your network and react if it comes under attack. Other Ways to Analyze Alert Data Using ACIDWho's Being Attacked?Using ACID, look up the most common IP destination addresses. This shows the IP addresses that are supposedly getting attacked the most, and therefore they are the machines to focus your security efforts on. This also helps you discern false positives from real ones, as you may find one particular machine generating a huge number of alerts from an application it is running. A sudden upsurge in alerts to a particular IP address could point you to an attack on that machine that is underway. Then you can batten down the hatches by running vulnerability scanners, checking patch levels, dropping packets from the offending source IP(s) at the router, and so on. Who's Doing the Attacking?Look at the IP source address that appears the most often. Go to the source IP list off the main page; this shows the IP and then the Fully Qualified Domain Name (FQDN). This tells you where the attack is coming from. Sorting by the number of alerts lets you see the worst offenders in terms of generating alerts. If the IP addresses with the most alerts are on your network, you may have an internal culprit or an application that is triggering an alert. Use the process discussed earlier to drill down to the alert detail level and analyze the alerts. If they are from external IP addresses, you will want to determine if this is legitimate traffic bound for your network or actual attacks. Look at the individual alerts to see what they are trying to do. Click on the IP address; this displays a page with additional information on the address and some options to analyze it further (see Figure 8.5). You can perform various functions on that address such as reverse DNS lookup, ARIN lookup, and even a Sam Spade search (similar to the tool studied in Chapter 2) from within ACID. The output of these functions should tell you what organization owns those IPs, any contact e-mails for their network operations center, and abuse e-mail contacts (if available). You can use these contacts to register a complaint about these activities. Also, if you see certain addresses showing up again and again, you can filter these IP addresses at your router or firewall. Figure 8.5. ACID Source IP Address Detail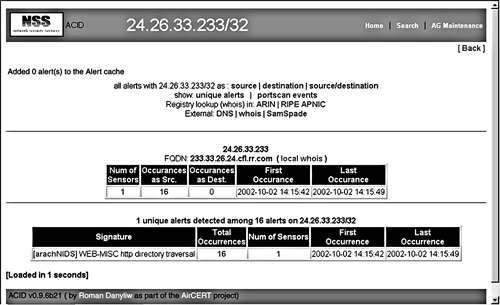 What Service Is Being Attacked the Most?By looking at the most common ports on which alerts are being received, you can see what services are being targeted. If you see a lot of Web-based alerts, you will want to pay closer attention to keeping your Web servers properly locked down. If the alerts show a lot of Windows NetBIOS activity, you will want to look at your Windows permissions and password policies. This will give you a good idea of what services to focus your attention on first. Using ACID on a Daily BasisOnce you have ACID running and sufficiently tuned for your NIDS configuration, you should get in the habit of checking it at least once a day to see what new alerts have been generated. A good rule of thumb is to check first thing in the morning and again just before you go home. If you have after-hours personnel working, you could also add checking the ACID alert database to their routine. When you log into the ACID database, you can go immediately to the Snapshot section (see Figure 8.6) and click on Most Recent Alerts to get a quick view of the most current activity. This shows you all the alerts in chronological order. If it is still generating too many alerts to be useful, in the Today's Alerts section select Unique. This shows you all the alerts from today grouped by alert type so you can see which ones are generating the most traffic. The Snapshot section options Last 24 Hours and Last 72 Hours are also useful. These let you search on the most frequent alerts, addresses, and ports during various periods. Figure 8.6. ACID Snapshot Section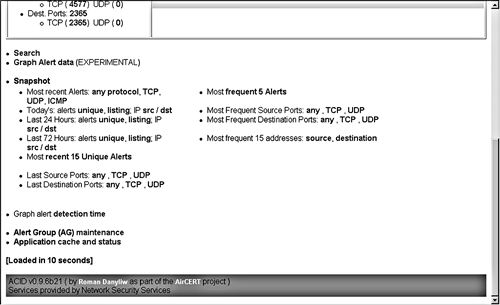 Graphing ACID DataIf you are more of a visual person or you need something graphical to show management, ACID comes with the ability to create graphs and charts based on your alert database. This feature is still experimental, and you must have the PHP graphing modules listed at the beginning of this section. However, this does give you some nice options for outputting graphical summaries of Snort data. You can access the graph feature by clicking on Graph Alert Data just below the Alert statistics box off the main ACID screen. This displays the graphing options. You can arrange the data for your graph by:
Set your parameters using the pull-down boxes and click on Graph Data. Make sure you have filled in every box or you will get an error message. ACID generates and displays a graph. See Figure 8.7 for an example of an ACID graph Figure 8.7. ACID Alert Data Graph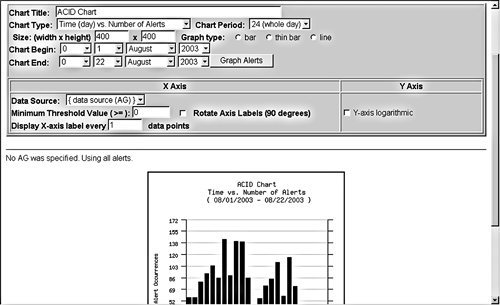 Maintaining Your ACID databaseAs your alert database grows, you will need to perform some maintenance on it periodically to keep it from getting too big and unwieldy. Also, your statistics and graphs will be more accurate if you archive your early alerts, which will contain many false positives. In addition, cleaning out your database from time to time will make your queries process faster. To archive your alerts, use the query control at the bottom of the main screen. Create a query for the alerts you want to archive, for example, all the alerts generated last year. Then select Archive Alerts as the action for your query. You can selectively archive alerts by date, alert type, or other criteria. You can also choose to just copy the alerts into the archive or to remove them. The archived alerts will be placed in their own database with the name you set in the acid_conf.php file during configuration. You should archive all of your alerts from the first few months of operation when you are fine-tuning the Snort sensor. After that, the data will have more relevance to actual attacks versus false positives. It is also a good idea to archive at least once a year or perhaps quarterly depending on the volume of alerts being logged. As a general rule of thumb, you don't want more than 100,000 alerts in your database at any given time. So, you now know how to build a complete Snort intrusion detection network, with multiple sensors logging into a database tool that can be used to analyze the data and do reporting. This will help you better use the intrusion detection data, make the most of your security efforts, and have some tangible reports and graphs to show management. Now, we will look at some tools that can help with your vulnerability scan data.
One problem when using the vulnerability scanner Nessus to scan medium- to large-size networks is that the reports can be quite intimidating. The Nessus reporting formats themselves are fine and the HTML is fairly easy to navigate, but when you have a couple of hundred pages of data to sort through, it can be hard to see the important data amongst all the noise. It would be nice to have something to organize the scan data any way you like. To really be able to analyze it, you need to get your data into a database versus the standard flat file format. You also want to be able to access the data easily, such as from a Web-based interface. With this capability, you could quickly get to the most important data and analyze scan results over time to see if your network was getting more secure or less secure. Fortunately, several products integrate Nessus with a database. A few of the Nessus-to-database programs are NesQuik, Java Nessus Report Manager, and Nessus PHP Interface (NPI). I selected NPI for this book for a number of reasons. First, it is a truly open source product with no commercial ties. Also, it uses MySQL and PHP, which you have already used for other tools such as ACID. Using these applications, NPI offers the ability to port your Nessus data into a database and then view it with a Web browser NPI, similar to ACID in its design, uses a MySQL database to store the results and a PHP-enabled Web server to view and query the results. Figure 8.8 illustrates the logical components of NPI. One difference between the Snort and Nessus architectures is that with Nessus there are two different parts generating the data: a client initiating the scans and a server running them. In some cases they might be on the same machine, but this figure shows two different physical servers. There is also database server to which the scan data is logged, and a Web server that provides the interface to the data. Again, the database and Web server could be on the same machine or two different boxes. Figure 8.8. NPI Logical Design
Figure 8.8 demonstates the flow of data and the logical parts in the NPI system. The Nessus client logs into the Nessus server to initiate a scan of a target. The data is stored on the client machine in the native Nessus .nbe format. Once you have the raw file, NPI runs a conversion script on the .nbe file and imports the data into a MySQL database. When the scan data is in the database, you can view and query the database using a Web-based PHP interface from any Web browser. This sounds like a much better way to analyze scan data, so let's get busy and set up NPI. Installing NPIBefore beginning to install NPI, you need to have your MySQL server and Apache Web server with PHP working. If you haven't already gotten these up and running, refer back to the appropriate sections earlier in this chapter. Once you have your SQL and Web servers ready, take these steps to install NPI.
You have now installed the NPI program. Importing Nessus Scans into NPINow you are ready to import some Nessus scans into your database.
Using NPIYou can now browse your scan data like any other database, sort it, and run queries to find specific vulnerabilities, hosts, or other criteria. There are quite a few way to analyze your Nessus data using NPI. You can sort by the:
By creating queries with NPI, you can focus on areas that represent the greatest danger to your network and maximize the effects of your remediation activity. You can also quickly rule out certain alerts and/or machines. With NPI, you can manipulate your scan data any way you choose. One downside to the NPI tool is manually loading each scan file into the database. A script could easily be written to automate this process, but some associates and I decided to take it one step further. |
|
|
< Day Day Up > |
|