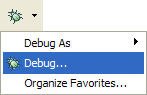
2.6. Debugging the ProductInevitably, during the course of producing a product, you'll need to debug a problem or you'll simply have to gain a better understanding of the code through a means more enlightening than just reviewing the source code. You can use the Runtime Workbench to determine exactly what happens during product execution so that you can solve problems. 2.6.1. Creating a configurationThe first step in this process is to create a configuration in which the product can be debugged. Start by selecting Debug... in the Debug toolbar menu (see Figure 2-21). Figure 2-21. Debug menu.
In the dialog that appears (see Figure 2-22), select Eclipse Application and then click the New button. Next, enter "Favorites" as the name of the configuration. Figure 2-22. Defining a new configuration.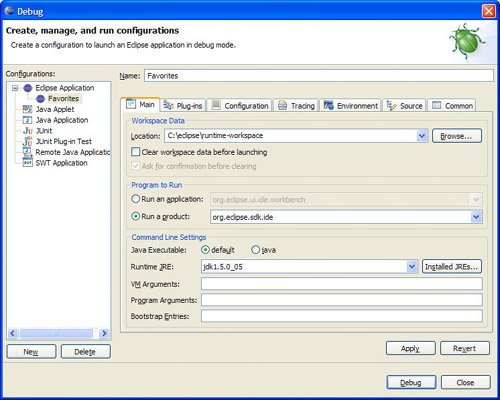
2.6.2. Selecting plug-ins and fragmentsAfter the preceding, select the Plug-ins tab and the radio button labeled Choose plug-ins and fragments to launch from the list (see Figure 2-23). In the list of plug-ins, make sure that the Favorites plug-in is selected in the Workspace Plug-ins category but not in the External Plug-ins category. Figure 2-23. Selecting plug-ins in the configuration.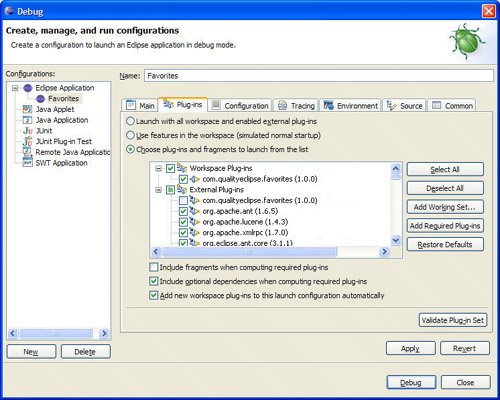
Tip Plug-in projects specified in the configuration take precedence over plug-ins installed in Eclipse itself. If you have a plug-in project with the same identifier as a plug-in installed in Eclipse and want to use the installed plug-in in the Runtime Workbench rather than the plug-in project, uncheck the plug-in project in the Workspace Plug-ins category and check the installed plug-in in the External Plug-ins category. 2.6.3. Launching the Runtime WorkbenchClick the Debug button to launch the Eclipse Application in the Runtime Workbench to debug the product. Now that you've defined the configuration and used it once, it appears in the Debug toolbar menu (see Figure 2-21). Selecting it from that menu launches the Runtime Workbench without opening the Configuration wizard. After clicking the Debug button in the Configuration wizard or selecting Favorites from the Debug toolbar menu, Eclipse opens a second workbench window (the Runtime Workbench, as opposed to the Development Workbench). This Runtime Workbench window executes the code in the projects contained in the Development Workbench. Making changes and setting breakpoints in the Development Workbench affects the execution of the Runtime Workbench (see Section 1.10, Introduction to Debugging, on page 58 for more about this). |