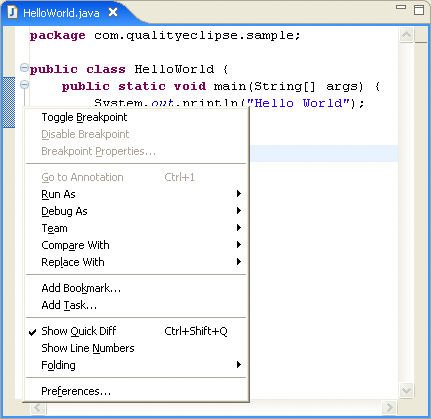
1.10. Introduction to DebuggingThe previous section showed how to run a Java application using the options available under the Run menu. Any output or errors are written to the Console view. Placing System.out.println() statements at appropriate places in your code will give you limited debugging capabilities. Fortunately, Eclipse provides a much more effective debugging solution in the form of its integrated Java debugger. The easiest way to debug a Java application is to select the class and then select the Run > Debug As > Java Application command (Ctrl+Shift+D, J) or the 1.10.1. Setting breakpointsTo stop the debugger at a particular location in the code, set a breakpoint. At the location where you would like to set the breakpoint, right-click in the marker bar of the editor and select the Toggle Breakpoint command (see Figure 1-66). In addition to right-clicking, you can double-click the marker bar to the left of the line at which you want to place the breakpoint. A breakpoint marker appears next to the appropriate source code line. Figure 1-66. Adding a breakpoint.
With one or more breakpoints set, the application runs until it encounters a breakpoint and then stops before executing the line with the breakpoint. The debugger shows which program threads are running and which ones have been suspended. It also shows the line of code at which execution has stopped and highlights that line of code in the editor (see Figure 1-67). Figure 1-67. The debugger, stopping at a breakpoint.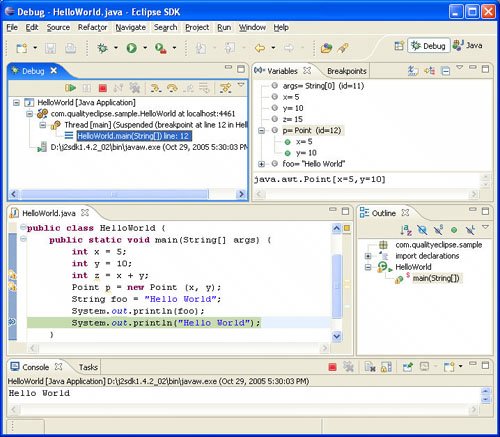
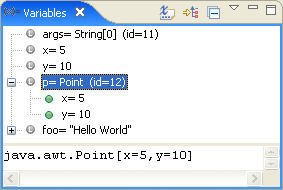
Tip If you are not hitting a breakpoint that you set, take a close look at how the breakpoint appears in the gutter. For an enabled breakpoint, you will see either a plain blue bullet or a blue bullet with a small checkmark. The checkmark icon appears only after launching the VM and the breakpoint exists in a loaded class. Tip Check the Remove terminated launches when a new launch is created checkbox on the Run/Debug > Launching preference page to automatically clean up old launches. 1.10.2. Using the Debug viewAfter execution has stopped on a breakpoint, the Debug view presents various options for resuming execution, stepping through the program statement-by-statement, or terminating it altogether. The The 1.10.3. Using the Variables viewThe Variables view shows the state of the variables in the current stack frame (see Figure 1-68). Selecting a variable shows its value in the details pane at the bottom of the view. Primitive variable types show their values directly, while object types can be expanded to show their individual elements. You can change the value of a primitive in this view, but you can't change the value of object types unless you use the Expressions view (see Section 1.10.4, Using the Expressions view). Note that the variables listed in the Variables view change as you step through your program. Figure 1-68. Variables view.
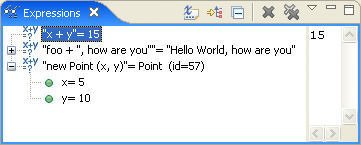
1.10.4. Using the Expressions viewThe Expressions view (see Figure 1-69) provides a place to inspect values in the debugger and discover the results of various expressions entered into the editor, the detail pane of the Variables view, or the detail pane of the Expressions view. Figure 1-69. Expressions view.
To use the Expressions view, first select the expression to execute. This can be an existing expression or one that you enter. Next, select the Watch, Display, or Inspect command from the popup menu in the editor, the Variables view, or the Expressions view. If you select the Display command while an expression is selected in an editor, the results will be shown in the Display view. When an expression is selected in the Variables view or Expressions view, the results will be shown in the detail pane of that view. If you select the Inspect command, a popup window containing the results of the expression appears. Pressing Ctrl+Shift+I will move the results to the Expressions view. As with the Variables view, primitive variable types show their values directly while object types can be expanded to show their individual elements. |