10.1. Tracking Web StatisticsIt's all very Web 1.0, but people still care about page views. Web statistics analysis and tracking is comprised of a lot more than raw page views, including statistics that can provide important information about the usability of your application. Enlightened thinkers suggest that we shouldn't be interested in the volume of traffic our application serves (ignoring the capacity-planning aspect) because interaction with the application is what's important. If you subscribe to this theory, web statistics tracking can still provide you with useful data. The first important piece of information we can extract is by looking at the relative number of page impressions for different pages. If we see that one aspect of our application serves many more pages than another, we can infer user thoughts and behavior. We can drill down further into relative numbers by looking at the cookies sent with each request. If we look at the number of cookied user sessions versus uncookied, we can see our adoption rate. If we look at the average session time and average pages per session, we can get an idea of how users are using our applicationjust dipping into a single page or spending a long session viewing many pages. More interesting still is looking at pathways through the site. How many users come to a certain page view via one link and how many via another? Of all the users who hit the front page of the site, how many are clicking straight through to a particular feature, how many go straight to the feature via a bookmark, and how many find another route? What pages do users usually end a session on (useful for finding dead ends)? We can also look at the other end of the session and examine where users came from. How many are coming straight into our application via a bookmark or typing a URL versus linking from a third-party site? In the case of third-party referrals, are we getting more traffic from links sent virally by email or by sites linking to us? In the case of the latter, are we getting linked to from corporate sites, weblogs, or discussion forums? All of this information is extremely useful when you try to build a picture of your users and their usage patterns. Whether raw traffic numbers interest you or not, usage patterns always should. So how can we extract these statistics? 10.1.1. Server LogfilesBy default, Apache writes two logfiles to disk: the access log, which contains a line for each request coming into the server, and the error log, which contains a line for each error response generated, as well as debugging messages from Apache and the loaded modules. We can analyze the data in the access log to extract information about total request and page counts, bandwidth, popular pages, user paths, external refers, browser usage, and a whole host of useful information. The access log records access requests in chronological order, which makes processing the logs to extract statistics fairly easy. Specifically, we can easily skip to a point in time to continue analysis from a previously recorded point. Apache doesn't have any built-in mechanism for "rotating" logfiles. When we talk about rotating logs, we mean starting a new logfile after a specified time or log size is reached. This generally involves stopping the server from writing to the old log, moving it out of the way, and creating a new log. For Apache on Unix, we simply rename the current log while the server is running and then send a HUP signal to the server process, which tells it to create a new log and start using it. If you're using access logs, rotation is essential once your application starts to grow. Under 32-bit Linux, the default maximum file size is 2 GB. If your access log reaches thissize, Apache will crash and be unable to start up. If your error log reaches this size, it will be unable to start and unable to report the problem (since it can't append to the error log). Even if you don't hit the maximum file size, you might instead run out of disk space, which is usually not a good thing. Rotation can be automated through the rotated daemon (like many Unix utilities, we pronounce the "d" on the end separately). This daemon allows us to specify time or size limits for logs and a renaming scheme, and we can have it gzip old logs. Once you have log rotation in place, it is still important to plan for what happens when you run out of disk space for archived logs. rotated can automatically delete logs over a certain age, but you may want to transfer them somewhere else to be permanently archived. Log rotation and archiving are best set up early to avoid the consequences of running out of file or disk space. 10.1.2. AnalysisOnce we've rotated out our logfiles, we can perform some analysis on them. There are various free open source log analyzers you can install that do a reasonable job. Analog (http://www.analog.cx/) is usually the fastest to run, but its output is fairly cryptic and configuring it to extract anything particularly useful can be an exercise in frustration. Webalizer (http://www.mrunix.net/webalizer/) is a very similar tool with slightly more readable output, but it runs at about half the speed of Analog. Analog can generate computer-readable output that you can then feed into Report Magic (http://www.reportmagic.org/) to generate pretty reports for you. An Analog report looks as exciting as Figure 10-1. Figure 10-1. An Analog report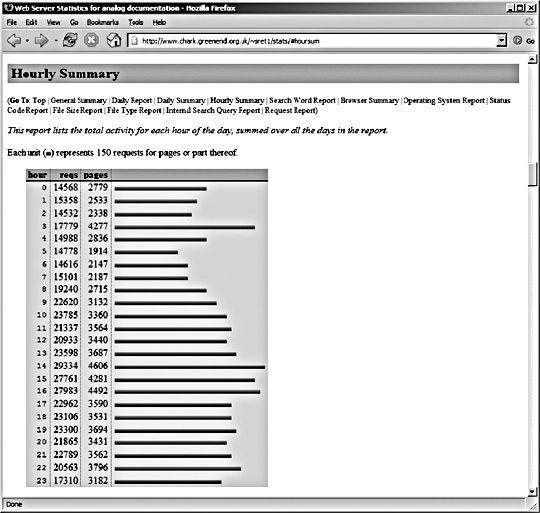 The same data runs through Report Magic afterwards looks like Figure 10-1. Figure 10-2. More detail in Report Magic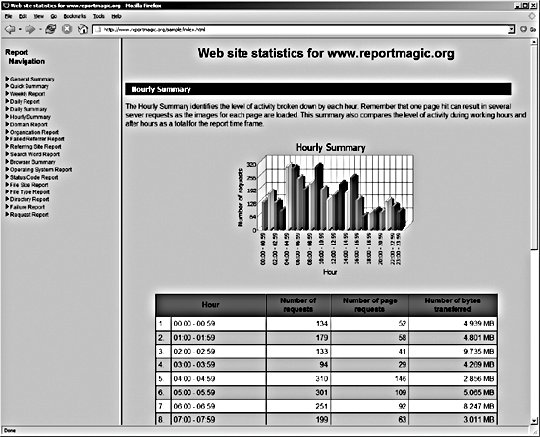 The main problem with this approach is that it doesn't really scale. Past a single web server, we need to take the logfiles and merge them into chronological order. This merging can take a long time when the logs are fairly large. A dedicated server may be needed before long, just to merge and analyze the logs. At some point, the logfiles get too large to merge and analyze at the speed they're being created. Clearly we need a better solution in these cases. 10.1.3. Using BeaconsA beacon, sometimes referred to as a "bug" or "tracker," is a tiny, (usually) invisible image that you add to the pages of your application for statistical tracking. You can either host the beaconur self or use an external service provider that will then provide you with a fragment of HTML to include in your pages. Using beacons enables you to get around the problem of high volumes of logs on your main web servers because the logging can be done by auxiliary hardware and only logs web pages rather than requests. When your application scales to multiple web servers, you can continue to log using a single beacon server, since the beacon server will be doing much less work. In this way, we can avoid the issues with merging logfiles, perhaps indefinitely. The main downside to using a beacon for stat tracking is that it can only track regular pages requests. It won't give you any information about image, script, and style files served, or non-HTML content such as data feeds and API calls. In fact, beacons can't even record page visits accurately. Users might have images turned off, have images from third-party sites disabled (if you host the beacon yourself this won't be an issue), or merely navigate away from the page before the beacon has been requested. Because we need the browser to request the beacon image to log the hit, it's good practice to put the beacon at the very start of your page's body block. Browsers typically load images top to bottom, so the earlier it appears in the page the more likely it is to be loaded on every page. When using beacons, we're actually tracking the requests for the beacon image rather than the page itself, and this has some annoying side effects. We can't directly track the page referrer because the beacon image won't know anything about it. We also can't directly look at the path requested because it'll always be the same (the path to the beacon). We can get around this by stashing the page path and referrer into the path for the beacon. For instance, if we were requesting the url /foo/ with a referrer of /bar/, then we might want to point to the beacon as /beacon?path=/foo/&ref=/bar/. Of course, this information doesn't appear directly in the beacon's logfile in the path and referrer fields, but we can fix this with a few Apache tricks. The LogFormat directive lets us specify the format for each line in our access log. The default "combined" log format looks like this:
LogFormat "%h %l %u %t \"%r\" %>s %b \"%{Referer}i\" \"%{User-agent}i\"" combined
The elements we're interested in are %r, which contains the original request line, and %{Referer}i, which contains the referrer header. There are some other fields you might want to transform, but I'll leave that as an exercise for the reader. The %{FOO}e syntax allows us to include an environment variable as part of the log line, so all we have to do is get the information we want into an environment variable. We can do this using a little mod_rewrite magic to find query parameters in the string. We can match against the query string of the beacon request to find the original request and referrer info, stash them into environment variables, and then finally create a log format with them:
RewriteEngine on
RewriteCond  %{QUERY_STRING}    req=([^&]+)
RewriteRule  .*      -    [E=LOG_REQ:%1]
RewriteCond  %{QUERY_STRING}    ref=([^&]+)
RewriteRule  .*      -    [E=LOG_REF:%1]
LogFormat  "%h %l %u %t \"%{LOG_REQ}e\" %>s %b \"%{LOG_REF}e\" \"%{User-agent}i\"" combined
So long as we pass the correct values for req and ref in the query string for the beacon, the beacon server's log lines will look identical to the log lines of the origin web server. The real problem with this approach is that to reach any kind of level of redundancy, we'll need at least two beacon servers. If we load balance between them, we end up with the same issuemultiple logs that need merging and analyzing. We can avoid a little of this by using multiple beacon servers in a master/slave relationship, where we switch over to the secondary machine only when the primary machine fails. In this case, we just need to append the log of the secondary server to that of the primary server to get a complete sorted log. We can avoid these problems altogether by using an external service to host our beacon and analyze the data. Services such as Hitbox from WebSideStory (http://www.websidestory.com/) are easy to set up and get running with. A word of caution, though: many of these services charge by volume and don't have sensible pricing schemes for excessive use. You don't want to get into a situation where you get sent a huge bill for stat tracking as traffic starts to grow. Products for larger applications do exist; however, they tend to be fairly costly. Webtrends (http://www.webtrends.com/) has been a prominent company in this field since the late 90s and offers both hosted and self-run versions of their analytics suite. Enterprise-level products tend to cost upwards of $10,000, so they can make quite a dent in small budgets and not really present a viable option for startups. The minimum system specification for a machine running WebTrends Enterprise 7 includes twin 3 GHz processors and a nice big 6 GB of memory just to enable all of its features for a million pages views day. Of course, by the time you read this, 6 GB of memory will cost less than a bus ticket, but presumably the requirements for high-volume analysis will have increased accordingly. 10.1.4. SpreadTo avoid the sorting and merging of multiple logfiles, we can stream each logfile to a central location as it is written, recording events to a central server in the order they arrive. We could open a socket between each web server and our central log server, but that's a fair amount of overhead for just throwing logs around. Ideally, we can perform this service on top of the existing network without impacting other core services. For this task we can use multicast, which allows us to broadcast a message to multiple hosts at once, without having to send multiple messages. Multicast has a range of reserved addresses that switches repeat out to all ports, allowing multiple NICs to pick up the message. The way this works is fairly simple. A range of IP addresses (224.0.0.0-239.255.255.255) are reserved as multicast addresses. The first four bits of all these addresses is 1110, which identifies them as a multicast address. The following 28 bits define the "multicast group." Machines "subscribe" to a multicast group by listening for packets coming to that IP address and processing them. Multicast capable interfaces will receive all multicast packets on their network segment (and from other segments, depending on packet TTLs and router configurations), but choose to ignore any that no application has asked to subscribe to. To send a multicast message, we simply send a UDP datagram to a multicast IP. At the Ethernet level, this works by using a reserved range of MAC addresses: 01-00-5e-00-00-00 to 01-00-5e-ff-ff-ff. The three leading octets define the address as being multicast and the three remaining octets specify the multicast group. You might have noticed that there are only 24 bits for specifying the group in the MAC address, while there are 28 in the IP address. Each MAC address actually specifies 32 different multicast groups. It's then up to the interface to unwrap the frame if it looks like it's in a wanted group and then check the IP address of the encapsulated packet. The only problem with this is that multicast is unreliable. Because it's not stream oriented, we can't guarantee the delivery of each message to every host that cares about it. Collecting logs together via multicast might mean that we'd lose portions of the data. While this isn't the end of the world, it would give us skewed stats that don't hold a lot of value. The Spread Toolkit (http://www.spread.org/) is designed to overcome this limitation by adding a stream-oriented layer on top of multicast which uses message sequence numbers to allow clients to know when to rerequest failed messages. Because of this extra rerequest overhead, Spread is quite a bit slower than pure multicast. However, for more than a couple of machines, it's much faster than establishing a stream to each target machine. We can use the Spread Toolkit to multicast log lines from all of our web servers to one centralized server that collects them and logs them in arrival order. To add redundancy to this system, we simply add a second machine listening to the multicasts and logging the messages to disk. For logging Apache accesses through Spread, we can use mod_log_spread (http://www.backhand.org/mod_log_spread/), which allows us to log directly from Apache without first writing the log to disk. After installing mod_log_spread, we simply need to add some lines to our httpd.conf file in order to activate it: SpreadDaemon 4308 CustomLog $www_cluster combined This tells mod_log_spread to connect to a Spread daemon running on port 4308; you can use port@host syntax to point to remote daemons. We then tell Apache to write its log to a Spread group called www_cluster. Once we start the Spread daemon and restart Apache, we'll be logging requests using Spread. Of course, we need to hook someone up to listen to the messages being broadcast. For that, we can use spreadlogd, which can be downloaded along with mod_log_spread. We then run spreadlogd on one or more logging servers and start to record the logs. We can do this on a web server if we have spare disk I/O, or shunt it off onto dedicated boxes. The Spread Toolkit is a handy utility in the application architect's toolbox. Using Spread to aggregate logs is useful, but not the limit of the toolkit. Any kind of data that we want to log sequentially from a number of machines is prime for Spread'ing. If you have some kind of user-created data of which you get many a minute created (such as photos uploaded, discussions started, etc.), then you can use Spread to keep a real-time log of the new object events as they happen. We can then use this log to hook up various real-time looking glasses. At Flickr, we use Spread for logging uploaded photos from the web servers. We can then tail the Spread log and get a real-time feed of new photo URLs. Without Spread, we'd have to constantly query the database for new records, which would impact general system performance. 10.1.5. Load BalancersIf we step back and look at the logging problem as a whole, we can see that the problem is that multiple machines get traffic at once, while we want the log of it all in one place. It's likely that we have several components in our system that every request passed throughnamely our edge router, our switch, and our load balancer. Our routers typically work at layer 3, while our switches operate at layer 2, so neither of these appliances understands HTTP traffic enough to log it. Our load balancer, on the other hand, might be a layer 7 device. Some load balancers (such as NetScalers) allow you to collect Apache-like access logs from them directly, streaming them to a disk in another machine on the network. Although we still have to send the access logs over the network, we can do it with a single stream-oriented connection, which avoids clogging the network with Spread's retransmissions. In the case where we have a pair of load balancers for hot failover, we typically won't have a problem. In an active/passive pair, only one is handling traffic at any one time while the other stands by. When the balancers switch over (when one fails), the second balancer takes all of the traffic (typically via some Ethernet trickery) and can re-open the logging connection and continue to stream new accesses to disk. In the case where we have an active/active load balancer pair, or use global server load balancing, we're out of luck. In this case, the beaconing approach, the Spread approach, and the brute force merging approach can be effective. Either way, once we have the merged access log, we're still going to need to analyze it. This is no small task for a busy application serving thousands of pages a second and will require a dedicated machine just to perform analysis. The exact requirements of your application vary based on the volume of logs, the statistics you wish to extract, and the time in which you need to do it. The last item is fairly important. If you need the day's statistics to be available at the end of the day, incrementally crunching portions of the day's logs every hour (or more frequently) will allow you to keep on top of things. You'll still spend the same amount of time crunching logs, but spread it out over the day so that your logging boxes' CPUs aren't hanging idle for most of the day. When midnight rolls around, you'll only have a small portion of logs to crunch, delivering the fully analyzed logs almost immediately. If you're crunching logs every hour, then each portion can't take longer than an hour to analyze (otherwise, you could never keep up), so analysis would be available by 1:00 a.m. every night. 10.1.6. Tracking Custom MetricsThe kind of statistics collected in access logs and intuited by log analyzers doesn't necessarily provide all of the statistics and metrics you might care about. Nearly every application has activity beyond simple page views and user paths that can be useful to track. If your application accepts email uploads or has any other non-web communication channels, then you won't be able to track those via web server logs. Many applications will want to track the volume of emails sent, volume of new objects created, and so on. Some of these statistics can be collected via other system logs. Under Linux, both incoming and outgoing mail is logged in the /var/log/messages file if you're using Postfix as your transport (otherwise, you might find them logged elsewhere in /var/log). All of the same rules as with web access logs applywe need to collect together the logs from each host, merge them together into chronological order, and then analyze them. The task is typically mucheasier for these other logs because they're much shorter and thus easily merged. If your application is based around sending email to the extent that you're sending hundreds of mails per second, then you can either use Spread to merge logs in real time or stream the logs directly from dedicated email appliances (such as Ironports). Logs aren't necessarily the only way to extract useful statistics. For general application usage statistics, we can simply pull numbers straight from the database. By polling the database server periodically for the count of certain objects, we can graph the volume of objects over time, which gives us the rate of change. For instance, we can poll the discussion topics table hourly to get the total topic count. At each polling interval, we store the count in our statistics-tracking database, marking down the time at which the sample was taken. Plotting the data directly on a graph, we get a slope telling us the total number of topics being created, as shown in Figure 10-3. If we instead graph the difference between each sample, we get the number of topics created in that time period. Over the course of a few weeks, as Figure 10-4. shows, we can start to see very detailed activity patterns emerge. Figure 10-3. Total topics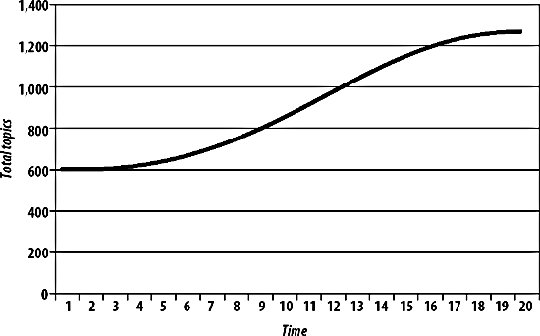 Figure 10-4. A very different view, looking at the rate of topic creation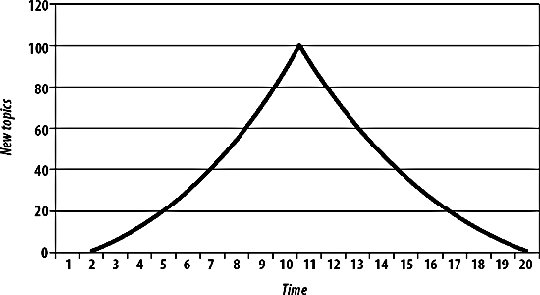 With these periodically polled stats, we can create a statistical dashboard for our application. This dashboard then provides a near real-time looking glass onto application activity and allows us to give an executive overview to the kind of people who like that sort of thing (typically executives). By sucking the data out of the database periodically and storing it in a compacted format, we can record trend data and graph it without having to hit the main database. This becomes especially useful as the database grows, allowing us to get statistics back very fast without having to wait to run tough queries against the main database. |