WebLogic JDBCMonitoring and Tuning
WebLogic provides extensive monitoring capabilities for JDBC connections using the administration console. This section briefly describes the types of monitoring and tuning you can do with JDBC. Refer to the WebLogic administration guide for a detailed explanation of the various features offered.
Tuning Your Connection Pool
To tune your connection pool, start WebLogic Server and the console. Now navigate to your connection pool in the tree pane of the console and click it. This opens the properties of the connection pool on the right side of the connection pool. Click on the Connections tab. You can see this screenshot in Figure 10.13. On this screen, you can tune the connection pool by setting the following properties of the connection pool.
Some of the basic properties you can set are
Initial Capacity
This is the number of connections to the database that are created when the JDBC connection pool is created at server startup. The default value is 1.
Maximum Capacity
The maximum number of connections that can be present in the pool. The default value is 15.
Capacity Increment
The number of connections that are added every time a connection is needed. Default value is 1.
Statement Cache Size
The number of statements that are cached per connection. By default, caching is not turned on; that is, the cache size is 0.
You can also configure some advanced properties of the connection pool. To do this, click the Show link.
Login Delay
The number of seconds to wait between creating two physical connections. The default is 0.
Allow Shrinking
If the connections of the pool aren't being used, this property will determine whether the connection pool should give up those connections. By default, shrinking is allowed, and this is the recommended approach.
Shrink Frequency
The number of seconds before which the server shrinks connections that aren't used. This property is used only if you've selected the Allow Shrinking property. The default value is 900 seconds.
Enable Connection Leak Profiling
Indicates to the server that it should gather any leak information from JDBC connections. By default, this value is not set.
Test Frequency
Indicates the number of seconds before which the server tests each unused connection. If a connection fails, that connection is given up and a new one is opened. By default, this property is set to 0, indicating testing isn't performed. If you set it to a positive value, you must also specify a valid Test Table Name value, as described later.
Test Reserved Connections
Indicates to the server whether it has to test connections before handing them over to the client. By default, this value is not set. If you set this value, you must also specify a valid Test Table Name, as described later. Testing connections at reserve might cause a performance impact, but the client is assured of receiving a working connection.
Test Released Connections
Indicates to the server whether it has to test connections that are released by clients. By default, this value is not set. If you set this value, you must also specify a valid Test Table Name value, as described later.
Connection Reserve Timeout
The number of seconds after which the request to reserve a connection from the pool will timeout. By default, the value is set to 10 seconds. If you set this to 1, the request will never timeout.
Connection Creation Retry Frequency
Indicates the number of seconds between retry attempts to create a connection. The default value is 0.
Inactive Connection Timeout
The number of seconds of inactivity on a connection after which the server reclaims the connection from the client and releases it back to the pool. The default is 0.
Maximum Waiting for Connection
Indicates the maximum number of requests that can wait for a connection to be handed out by the pool at any time. By default, this is a very high number.
Maximum connections Made Unavailable
When the server tests or refreshes connections, they aren't available for clients. This parameter identifies the maximum number of such connections that can be made unavailable at any time.
Test Table Name
Identifies the table to be used to test the physical connections at various points. At what points these connections are tested depends on other parameters on this screen, as discussed earlier. You can also put in an SQL code in this place for the server to execute that SQL on the connection. SQL code should begin with the word SQL, followed by a space. For instance, the values TEST_TABLE and SQL SELECT COUNT(*) FROM TEST_TABLE produce the same result.
Init SQL
You can specify an SQL statement that will be executed on every connection that's created. This SQL code will typically be used to initialize the created connection. You may leave this field blank (which is the default behavior), and disable the server from running any SQL code. The SQL statement you put in here should begin with the word SQL, followed by a space.
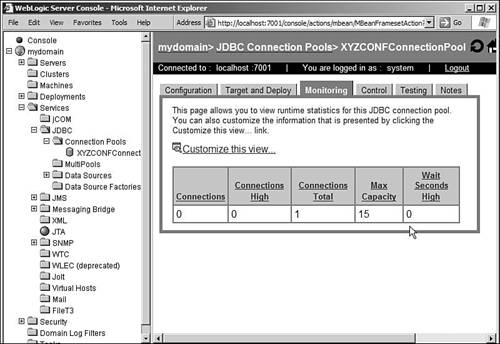
Monitoring a Connection Pool
In the Connection Pool Properties page, you can also monitor the connection pool by clicking on the Monitoring tab. You can customize the properties of your connection pool that has to be displayed on this screen by clicking on the Customize This View link. Some of the fields that can be monitored using this screen are given in the following list. You can look at a screen shot of a sample monitoring page in Figure 10.14.
Connections
The number of connections currently being used by clients.
Connections High
The maximum number of connections that were used from this pool at any given time. It's a good idea to iteratively tune the Maximum Capacity property of the connection pool based on this parameter.
Connections Total
Indicates the number of connections that are currently established within this pool. Initially, WebLogic Server starts with as many active connections as indicated by the Initial Capacity parameter. It subsequently adds active connections as and when required until it reaches the Maximum Capacity value. All connections that have been free for the number of minutes indicated by the Shrink Period parameter, and which are over and above the number indicated by Initial Capacity, can be shrunk. In other words, connections are closed at this time. This is done to conserve system resources. As discussed in the previous sections, it takes time to reconnect to the database, so you must configure the Initial Capacity and Shrink Period values based on the volume of database requests you expect.
Wait Seconds High
The longest any client has had to wait before it has been serviced by this connection pool. Obviously, a big value in this field indicates a bottleneck in your application. You might want to increase the Maximum Capacity value of your connection pool if your resources permit. Tuning SQL statements also makes database access faster, thus making connections available faster for other clients.
Waiters High
The maximum number of clients that have waited for a connection from this pool. Again, a high value in this field could indicate a bottleneck.
These parameters can also be monitored programmatically by using the JDBCConnectionPoolRuntimeMBean, which is the same management bean that enables you to monitor the connection pool using the console.
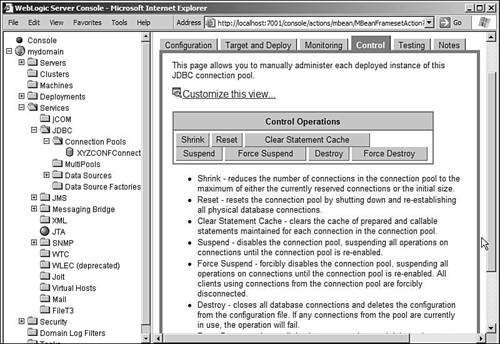
Controlling a Connection Pool
You can control a connection pool by clicking the Control tab of your connection pool configuration page. You can see a screen shot of this page in Figure 10.15. Here you can perform the following tasks on your pool. Note that you can also perform all of these operations using the JDBCConnectionPoolRuntimeMBean bean.
Shrink
Shrinking a pool makes the server release unused connections from the pool that are over and above the initial capacity of the pool. Although the server does this automatically if you've enabled shrinking, this option is available for you if you want to perform this activity explicitly.
Reset
Occasionally, you might want to force the server to reset the connection pool, which ensures that all connections are closed and reopened. For example, this might be required if you restart your database or if you feel that the connections are failing.
Clear Statement Cache
This option enables you to clear the statement cache (if any) maintained for each connection within your connection pool.
Suspend
This option enables you to suspend a connection pool, thus preventing clients from receiving connections out of this pool. If a client already has a connection reserved, executing any statement on this connection results in an exception.
Force Suspend
This option enables the server to forcibly suspend all connections within the pool. Any transaction that's executing on the connection is rolled back, and all applications are disconnected. The connections are closed and reopened.
Resume
Resumes the connection pool, and clients can now get connections from this pool.
Destroy
Closes all connections from the pool, and the configuration is deleted from the configuration file. If any client is currently using a connection, this operation will fail.
Force Destroy
All clients using the pool are disconnected and the connection pool is destroyed. The configuration is removed from the configuration file. You must have a very good reason to perform a Destroy or a Force Destroy operation.
Validating a Database Connection from the Command Line
WebLogic provides utilities with which you can test for a two-tier or a three-tier database connection to the database from the command line using the JDBC driver.
To test for a two-tier connection, use the class utils.dbping. This utility can work with WebLogic jDriver for Microsoft SQL Server, WebLogic jDriver for Oracle, Oracle thin driver, and Sybase jConnect driver. You specify the user ID, the password, and the database name (in the correct format for the appropriate driver) to the dbping utility.
You can test for a three-tier connection using the utils.t3dbping utility. You must first test for a two-tier connection using the utils.dbping utility and start WebLogic Server before using this tool. This utility also works with the same database drivers as the two-tier version. This utility takes the URL of WebLogic Server, the database user ID, the password, the database name, the driver class name, and the database URL for the driver.
 |