Using the PHP/GD Drawing FunctionsNow that you have the basic concept of creating images and outputting them to the browser or a file, let's examine how to draw basic geometric shapes on a canvas using the GD extension drawing functions. PHP supports the drawing of various geometric shapes, including lines, rectangles, circles/ellipses, and polygons. Beyond simple drawing of these geometric shapes, the GD extension also supports filled shapes (solid circles, for example) and even the way a line itself is drawn can be manipulated using the concept of styles and brushes. However, before we get to those topics, we'll look at a number of basic drawing functions. Following are a few details that apply to each of the functions I will be discussing that are better to mention now:
Drawing Line-Based Geometric ShapesBeyond drawing a single pixel, the simplest shape that can be rendered on a canvas is the line. In PHP, lines are drawn on a canvas using the imageline() function whose syntax follows: imageline($img_r, $start_x, $start_y, $end_x, $end_y, $color); $img_r is the image resource to draw the line starting from the point ($start_x, $start_y) and ending at the point ($end_x, $end_y), using the color specified by $color. This function, when executed, draws the specified line on the canvas from the starting location to the ending location. Along with the line, the GD extension is also capable of drawing complex line-based shapes such as polygons and rectangles by using the imagerectangle() or imagepolygon() functions. Starting with imagerectangle(), the syntax is as follows: imagerectangle($img_r, $topL_x, $topL_y, $btmR_x, $btmR_y, $color); $img_r is the image resource, and the size and location of the rectangle is specified by providing the top-left point ($topL_x, $topL_y) and the bottom-right point ($btmR_x, $btmR_y). For example, to create a simple square on a canvas that is 10 pixels in size, starting from the upper-left corner you would use the following: imagerectangle($img_r, 0, 0, 10, 10, $mycolor); For line-based shapes more complex than the rectangle, the GD extension provides only the imagepolygon() function, which allows you to define an arbitrary number of points defining each vertex of the polygon. The syntax for the imagepolygon() function is as follows: imagepolygon($img_r, $points, $num_points, $color); $points is an array containing the X,Y locations of each individual vertex; $num_points is the total number of X,Y pairs in the array; and $color is the color to draw the polygon. Of course, as expected, the $img_r parameter is the image resource representing the canvas to draw on. It is important to note that the $points array accepted by the imagepolygon() function is of the following format:
<?php
    $poly_points = array( 0, 0,   // start at (0,0)
                         0, 10,   // next vertex (0, 10)
                         10, 10,  // next vertex (10, 10)
                         10, 0    // next vertex (10, 0)
                        );
?>
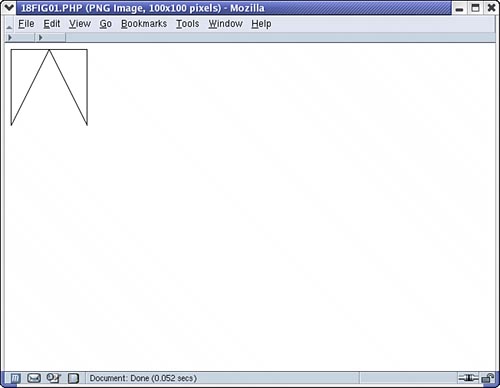
Index 0 and 1 of the array represent the first vertex, 2 and 3 represent the second, 4 and 5 represent the third, and so on. Also note that you are defining only the points on the canvas that make up the polygon, and when the polygon is rendered it will be automatically "closed" with a line connecting the last vertex back to the first. To illustrate this, Listing 27.1 creates a polygon shown in the following Figure 27.1. Listing 27.1. Drawing Polygons Using imagepolygon()
<?php

    define("WIDTH", 100);
    define("HEIGHT", 100);

    $img = imagecreate(WIDTH, HEIGHT);
    $white = imagecolorallocate($img, 0xFF, 0xFF, 0xFF);
    $black = Imagecolorallocate($img, 0, 0, 0);

    $points = array(0, 0,                // Vertex (0,0)
                    0, HEIGHT,           // Vertex (0, HEIGHT)
                    (int)WIDTH/2, 0,     // Vertex (WIDTH/2, 0)
                    WIDTH-1, HEIGHT-1,   // Vertex (WIDTH, HEIGHT)
                    WIDTH-1, 0);         // Vertex (WIDTH, 0)

    imagepolygon($img, $points, 5, $black);

    header("Content-type: image/png");
    imagepng($img);

?>
Figure 27.1. Using the imagepolygon() function.
Drawing Curved SurfacesAlong with drawing line-based geometric shapes, the GD extension also supports drawing curved surfaces such as circles, ellipses, and arcs. This is all accomplished through the use of the imagearc() and imageellipse() functions. Starting with the latter, the syntax for the imageellipse() function is as follows: imageellipse($img_r, $center_x, $center_y, $width, $height, $color); $img_r represents the image resource and $center_x/$center_y represent the X,Y coordinates of the center of the ellipse. The shape of the ellipse is defined by the $width and $height parameters, and everything is drawn using the color specified by $color. This function can be used to render both ellipses and circles (which are special cases of ellipses). As it turns out, the imageellipse() function is actually another special case in and of itself to the imagearc() function. The imagearc() function behaves exactly as its counterpart; however, it offers greater control by allowing you to specify how much of the ellipse to draw. The syntax of the imagearc() function is as follows:
imagearc($img_r, $center_x, $center_y, $width,
                $height, $start_ang, $end_ang, $color);
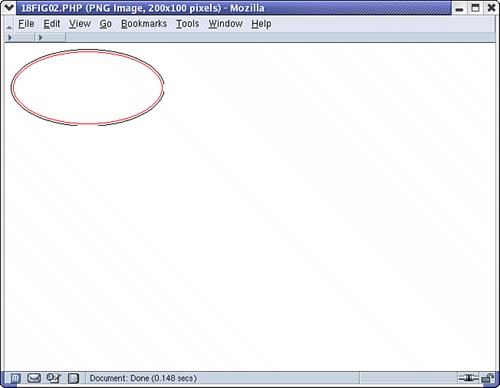
$img_r, $center_x, $center_y, $width, and $height are identical in function, as described for the preceding imageellipse() function. As previously mentioned, the imagearc() function requires two additional parameters, $start_ang and $end_ang, representing the angle range that will be rendered (in degrees, not radians). To illustrate the use of both the imageellipse() and imagearc() functions, Listing 27.2 uses both to draw ellipses in a simple image (the output of this script is shown in Figure 27.2): Listing 27.2. Using the imageellipse() and imagearc() Functions
<?php
    define("WIDTH", 200);
    define("HEIGHT", 100);

    $img = imagecreate(WIDTH, HEIGHT);

    $bg = imagecolorallocate($img, 0xFF, 0xFF, 0xFF);
    $black = imagecolorallocate($img, 0, 0, 0);
    $red = imagecolorallocate($img, 0xFF, 0, 0);

    $center_x = (int)WIDTH/2;
    $center_y = (int)HEIGHT/2;

    imageellipse($img, $center_x, $center_y, WIDTH, HEIGHT, $black);
    imagearc($img, $center_x, $center_y, WIDTH-5, HEIGHT-5, 0, 360, $red);

    header("Content-Type: image/png");
    imagepng($img);

?>
Figure 27.2. Drawing simple ellipses and arcs using GD.
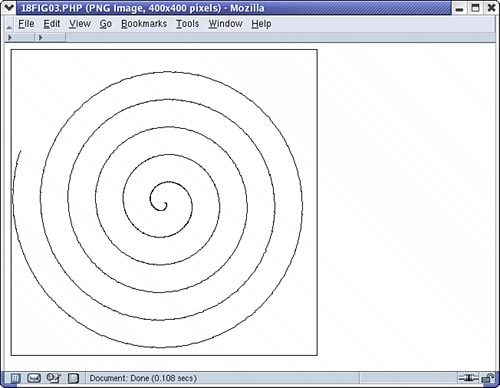
When working with the imagearc() function, it is important to realize the orientation when specifying the degree range to draw. Unlike what some may believe is the intuitive method, zero degrees (the beginning of the arc) starts at the three o'clock position, as shown in Figure 27.3. Figure 27.3. Drawing a spiral in GD.
To further illustrate how the imagearc() function can be used, I have included a not-too-useful (but interesting) example in which the imagearc() function has been used to draw a spiral. This example is shown in both Listing 27.3 and Figure 27.3: Listing 27.3. Using imagearc() to Draw Spirals
<?php

    define("WIDTH", 400);
    define("HEIGHT", 400);

    $img = imagecreate(WIDTH, HEIGHT);

    $bg = $white = imagecolorallocate($img, 0xFF, 0xFF, 0xFF);
    $black = imagecolorallocate($img, 0, 0, 0);

    imagerectangle($img, 0, 0, WIDTH-1, HEIGHT-1, $black);

    $center_x = (int)WIDTH/2;
    $center_y = (int)HEIGHT/2;

    $angle = 0;
    $radius = 0;
    while($radius <= WIDTH ) {
        imagearc($img, $center_x, $center_y, $radius,
                 $radius, $angle-5, $angle, $black);
        $angle += 5;
        $radius++;
    }

    header("Content-Type: image/png");
    imagepng($img);

?>
Filled Shapes and Image FunctionsAs I previously mentioned in this chapter, the GD extension can be instructed to automatically fill any of the geometric shapes that it renders. On top of this, the GD extension can also flood-fill regions of the canvas with a particular color. For instance, along with imagerectangle(), imagepolygon(), and imageellipse(), the GD extension also provides imagefilledrectangle(), imagefilledpolygon(), and imagefilledellipse(). All three of these new functions have an identical syntax to their already discussed counterparts; however, instead of simply outlining the image, these functions will also fill the entire geometric shape in with the specified color. Although these three functions are straightforward, the function that handles filling of arcs, imagefilledarc(), is not identical in syntax or use to its imagearc() counterpart. This is because an "arc" by definition is only a portion of an ellipse and therefore does not have any set boundaries to fill. However, as you will see, the imagefilledarc() function provides some nice functionality that can make our lives much simplerespecially when drawing something such as a pie graph. The syntax for the imagefilledarc() function is as follows:
imagefilledarc($img_r, $center_x, $center_y, $width,
                       $height, $start_ang, $end_ang, $color, $style);
Although identical in most respects, the imagefilledarc() function requires an additional parameter, $style, that its counterpart does not. This parameter is a bit-field consisting of one or more of the following constants:
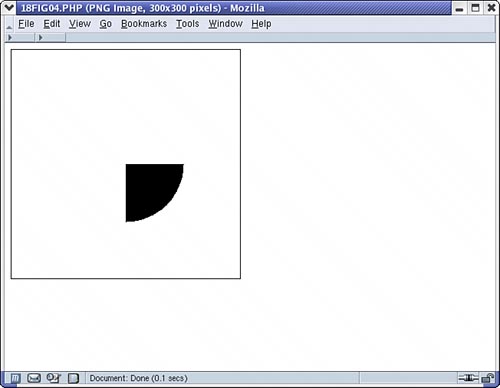
For many, I have found that even the best description of the preceding constants is not good enough for their meaning to be understood. So, before continuing, I'll provide some examples of the different combinations that the preceding constants render. Listing 27.4 draws a 90-degree arc using imagefilledarc(). Each of the following outputs uses this example with different combinations of constants for the $style parameter. Listing 27.4. Using imagefilledarc()
<?php
    define("WIDTH", 300);
    define("HEIGHT", 300);

    $img = imagecreate(WIDTH,HEIGHT);
    $bg = $white = imagecolorallocate($img, 0xFF, 0xFF, 0xFF);
    $black = imagecolorallocate($img, 0, 0, 0);

    $center_x = (int)WIDTH/2;
    $center_y = (int)HEIGHT/2;
    imagerectangle($img, 0, 0, WIDTH-1, HEIGHT-1, $black);
    imagefilledarc($img,
                   $center_x,
                   $center_y,
                   WIDTH/2,
                   HEIGHT/2,
                   0,
                   90,
                   $black,
                   IMG_ARC_PIE);

    header("Content-Type: image/png");
    imagepng($img);

?>
Figure 27.4. Drawing filled arcs.
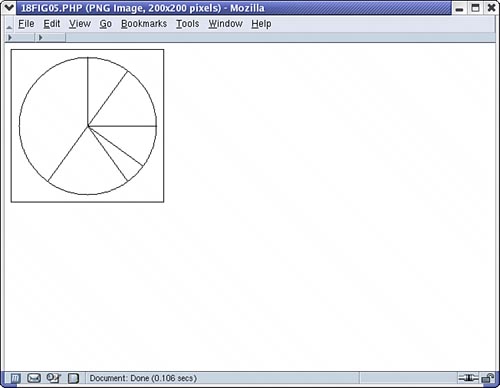
As you can see, the imagefilledarc() function provides us with a great deal of flexibility. The most practical example of using the imagefilledarc() function is the creation of a pie graph. An example of creating a pie graph onthe-fly based on data contained within an array is shown in Listing 27.5: Listing 27.5. Creating a Pie Graph Using imagefilledarc()
<?php

    define("WIDTH", 200);
    define("HEIGHT", 200);

    $piegraph_data = array (10, 5, 20, 40, 10, 15);

    $img = imagecreate(WIDTH, HEIGHT);

    $background = $white = imagecolorallocate($img, 0xFF, 0xFF, 0xFF);
    $black = imagecolorallocate($img, 0, 0, 0);

    $center_x = (int)WIDTH/2;
    $center_y = (int)HEIGHT/2;

    imagerectangle($img, 0, 0, WIDTH-1, HEIGHT-1, $black);

    $last_angle = 0;

    foreach($piegraph_data as $percentage) {
        $arclen = (360 * $percentage) / 100;
        imagefilledarc($img,
                       $center_x,
                       $center_y,
                       WIDTH-20,
                       HEIGHT-20,
                       $last_angle,
                       ($last_angle + $arclen),
                       $black,
                       IMG_ARC_EDGED | IMG_ARC_NOFILL);
        $last_angle += $arclen;
    }
    header("Content-Type: image/png");
    imagepng($img);
?>
The final two filling functions available in the GD extension enable us to perform flood fills of regions of the canvas with a specific color. The first of these functions, imagefill(), will replace any continuous region of a single color with another specified color. The syntax for the imagefill() function is as follows: imagefill($img_r, $x, $y, $color); Figure 27.5. Creating a pie graph using GD.
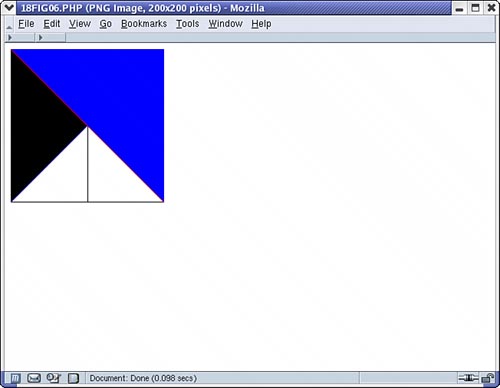
$img_r is the image resource, $x and $y specify the location of the color to replace, and $color is the index of the color in the palette to replace the current color with. This function has many uses; for example, it could be used in conjunction with the pie-graphing script in Listing 27.5 to fill in each pie slice with a different color (maintaining the black edge between each). Although imagefill() is useful, the GD extension also provides an alternative to imagefill() with a bit more flexibilitythe imagefilltoborder() function. The syntax for this function is as follows: imagefilltoborder($img_r, $x, $y, $border, $color); As you can see, both the imagefill() and imagefilltoborder() functions accept almost the same parameters. The only difference between the two functions is that imagefilltoborder() requires an additional $border parameter. Unlike imagefill(), this function will flood-fill a continuous region defined not by a single color, but rather the color specified by $border. To illustrate the difference between the two functions, consider Listing 27.6 and its output shown in Figure 27.6: Listing 27.6. Using imagefill() and imagefilltoborder()
<?php

    define("WIDTH", 200);
    define("HEIGHT", 200);
    $img = imagecreate(WIDTH, HEIGHT);
    $background = $white = imagecolorallocate($img, 0xFF, 0xFF, 0xFF);
    $black = imagecolorallocate($img, 0, 0, 0);
    $red = imagecolorallocate($img, 0xFF, 0, 0);
    $blue = imagecolorallocate($img, 0, 0, 0xFF);

    $center_x = (int)WIDTH/2;
    $center_y = (int)HEIGHT/2;

    imagerectangle($img, 0, 0, WIDTH-1, HEIGHT-1, $black);

    imageline($img, $center_x, 0, $center_x, HEIGHT-1, $black);
    imageline($img, 0, 0, WIDTH-1, HEIGHT-1, $red);
    imageline($img, WIDTH-1, 0, 0, HEIGHT-1, $blue);

    imagefill($img, 2, 20, $black);
    imagefilltoborder($img, WIDTH-2, 20, $red, $blue);

    header("Content-Type: image/png");
    imagepng($img);
?>
Figure 27.6. Using the image-filling functions.
As you can see from Listing 27.6, we have separated our image into a number of different regions separated by colored lines (red and blue lines, one across each diagonal). We then used the two different fill instructions on each half of the image. On the first (left) half, we used imagefill() and provided it a location within the "left" triangle, whereas on the second (right) half, we used imagefilltoborder(), with red as the boundary. When you compare the results, you can see that imagefill() stopped flood-filling as soon as it reached the border of the continuous white within the triangle. This is in juxtaposition to the imagefilltoborder() function, which filled everything from the right edge until it reached the continuous red border on the diagonal. |