When some software or hardware seems to be broken in Linux, there are some standard tools you can use to monitor what is happening with your system. Temporarily slow performance can be monitored using tools such as top, to see what the processes are doing at the moment. If an application isn't completing properly, you can trace the system calls it is making, by using the strace command.
If system performance takes a quicknosedive, top is a good way to check out what is going on. The top command shows the running processes on your system and allows you to sort these processes based across several parameters. Its graphical counterpart in the GNOME environment, called gtop, lets you easily sort information by clicking on columns in the gtop window.
The top command doesn't require a GUI, which makes it convenient for running from a virtual terminal or after logging in over a network using ssh from a Terminal window. To start top from a shell, simply type:
# top
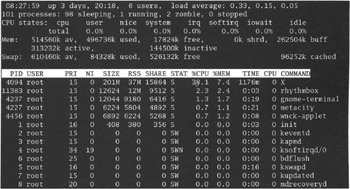
A list of running processes appears, displaying activity in real time. When you start top, processes are listed in order of current CPU usage (from most to least). By default, the screen is updated every 5 seconds to show the new order of CPU usages by your processes. Press the space bar to update information immediately. Figure 6-3 shows an example of an active top window in Fedora.
To get a feel for the information you are seeing on the top screen, you can try sorting the data in different ways. With top running and the Terminal window it's running in selected, sort the processes in the top window in the following ways:
Sorting this data in various ways can help you uncover problems on your system. Here are a few things you can do with top:
Check for memory usage-Press the M key to sort the top output by memory usage. Look under the RSS line to see the actual amount of physical memory being used by each process (such as 40M for 40 megabytes). Under the %MEM column, you can see the percentage of total physical memory the process consumes. Shared memory used by the process is listed under the SHARE column.
The Mem: line in the upper section of the top screen shows the total memory available on the system, along with how much is used and how much is free. It also shows shared memory and memory used for buffers. Swap information shows the total size of your swap area, along with how much of it is free or currently being used.
A large amount of swapping will cause a performance drag. Adding more RAM will improve performance in such situations.
Check for memory leaks-If an application has a memory leak (the memory it is consuming continues to grow over time), sorting by resident memory usage will point up processes that have grown out of whack with their memory use. Performance hits tend to really occur in cases where the growing process has caused frequent hits on swap space.
To check whether your system is frequently relying on swap space, try the free command.
   # free -m
                  total used free shared buffers cached
   Mem:           502           389    112        0        42      213
   -/+ buffers/cache:           133    369
   Swap:          596             0    596
In this example you can see that no swap space is being used, so if there is a memory leak, it probably isn't adversely affecting the system.
In some cases, processes that may appear to be experiencing memory leaks may not be leaking at all. An example is the gnome-terminal process (which is associated with a Terminal window). Over time, the gnome-terminal process may consume larger amounts of memory. This comes from the fact that each time you open a new gnome-terminal window, the new window relies on the old gnome-terminal process, but simply causes a small increase in the process' memory use.
Watch only selected processes-If you want to monitor only a few processes, you can enter the PID for the commands you want to watch on the top command line (up to 20 processes). Here is an example of top being used to monitor three different processes with PIDs of 4043, 4584, and 4353.
# top -p4043 -p4584 -p4353
Check general processor activity-There are a lot of things you can check regarding the general status of the CPU. The first line on the top screen shows the current time, followed by the uptime (how long the system has been running) and the load average. The three load average numbers represent the average number of processes ready to run in the previous 1, 5, and 15 minutes.
From the second line on the top screen, you can see the total number of processes currently running (since the screen was last refreshed). You can also see the number of processes that are sleeping (waiting for something to happen), running, or stopped. Zombie processes, which are also listed on this line, are actually processes that are dead but remain in the process table because their parent processes have not checked their exit status.
High load averages might indicate that the CPU is the bottleneck for slow performance. Press P to sort by processor usage to see which processes are making the most demands on the processor (as indicated by the %CPU column). Try some processor-intensive applications, such as 3D-graphics or video or audio compression to check out how much the processor can handle.
Sleeping and zombie processes are not drawing on the CPU. While some people find zombie processes disconcerting to have around, when exited their resources are released, so they store only a small amount of data (the exit status and process ID of the now defunct process). To see which of your processes are zombies, list the current processes (ps ax) and look for a process with a Z in the STAT line.
Give processes more priority-If you are using top as the root user, you can increase or decrease the priority of a running process (referred to as re-nicing the process). Press the r key, then type the PID of the process you want to re-nice. Next, enter the priority number you want to use. Priorities you can enter as root user range from 19 (lowest priority) to -20 (highest priority).
| Caution |
Re-nicing can be dangerous. It can cause some processes to hog the CPU beyond where you would intend, while causing others to be shut out from the CPU. Use this feature at your own risk. |
Kill processes-While you are on the top window, you can kill (or at least try to kill) any process you like. Press the k key and enter the PID of the process you want to kill. You are asked for the signal to use. By default, it will use the -15 signal (SIGTERM). Sometimes to kill a process, you might need to use -9 (SIGKILL) instead. (SIGKILL cannot be ignored and will kill the process without cleaning up.)
You can simplify the information you see in the top window in several ways. Press the i key to get rid of idle processes and just see the processes that are currently demanding attention from the processor. Normally, top just shows however many processes will fit on the screen. Press the t key to toggle some of the display summary information on and off.
Sometimes you run a command and it just hangs or fails outright with no indication of what went wrong. To find out what exactly is going on with the command, you can run the command using strace.
With the strace command, you can watch the system calls being made through the entire run of the command. I most often use strace to see where a command is getting configuration information from and what devices it's trying to open. As each call is made, a listing of that call is sent to standard error. Here's an example.
# strace /bin/ping anyhost.linuxtoys.net 2>/tmp/ping_out
Here I try to ping a host computer on the network. By running the ping with the strace command and directing standard error (2>) to the /tmp/ping_out file, a ton of processing messages are sent to the ping_out file. Just to get a quick idea of where ping is going to get its information from, I look for all the occurrences of open to see what files it is opening. Here's the result.
   # grep ^ open /tmp/ping.out
   open("/etc/ld.so.cache", 0_RDONLY)       = 3
   open("/lib/libresolv.so.2", 0_RDONLY)    = 3
   open("/lib/tls/libc.so.6", 0_RDONLY)     = 3
   open("/etc/resolv.conf", 0_RDONLY)       = 4
   open("/etc/nsswitch.conf", 0_RDONLY)     = 4
   open("/etc/ld.so.cache", 0_RDONLY)       = 4
   open("/lib/libnss_files.so.2", 0-RDONLY)  = 4
   open("/etc/host.conf", 0_RDONLY)         = 4
   open("/etc/hosts", 0_RDONLY)             = 4
   open("/etc/ld.so.cache", 0_RDONLY)       = 4
   open("/lib/libnss_dns.so.2", 0_RDONLY)   = 4
Besides opening the libraries, the ping command opened several configuration files to look for IP address information. I could see that it opened the resolv.conf, nsswitch.conf and host.conf files to find out where it should look to resolve names to IP addresses. Locally, it checked the hosts file for addresses.
From this output, I would be able to tell if any configuration files ping wanted could not be found or opened. Failed opens usually appear with a -1 return value and a No such file or directory message. Besides opens, you can also look for system calls such as lstat (which check the existence of a file), read (to see calls that read information from files), and signal symbols and strings (to see processes being interrupted).
There are many options to strace that you can read about on the strace man page. You can trace child processes (-f) and print relative timestamps (-r). You can also have it trace only certain system calls. For example to just trace open system calls in the previous example, you could type:
# strace -e trace=open /bin/ping anyhost.linuxtoys.net
Because GUI administration tools sometimes fail mysteriously, I will often run an strace on them to find out what is wrong. Launching some redhat-config-* commands with strace from a Terminal window will show where Red Hat is saving and accessing the information it is using with the tool.