|
|
|
11.3 Performance AnalysisObtaining in-depth data regarding various aspects of your target's performance is crucial for making the best use out of the target's capabilities. Though I can't cover all aspects of performance analysis, I will cover the most important ones. In the following sections, we will discuss process profiling, code coverage, system profiling, kernel profiling, and measuring interrupt latency. 11.3.1 Process ProfilingProcess profiling is a mechanism that helps understanding the intricate behavior of a process. Among other things, this involves obtaining information regarding the time spent in each function and how much of that time the function spent on behalf of each of its callers, and how much time it spent in each of the children it called. A single process in Linux is usually profiled using a combination of special compiler options and the gprof utility. Basically, source files are compiled with a compiler option that results in profiling data to be collected at runtime and written to file upon the application's exit. The data generated is then analyzed by gprof, which displays the call graph profile data. Though I will not cover the actual use of gprof and the interpretation of its output, since it is already covered in the GNU gprof manual, I will cover its cross-platform usage specifics. First, you must modify your applications' Makefiles to add the appropriate compiler and linker options. Here are the portions of the Makefile provided in Chapter 4 that must be changed to build a program that will generate profiling data: CFLAGS = -Wall -pg ... LDFLAGS = -pg Note that the -pg option is used both for the compiler flags and for the linker flags. The -pg compiler option tells the compiler to include the code for generating the performance data. The -pg linker option tells the linker to link the binary with gcrt1.o instead of crt1.o. The former is a special version of the latter that is necessary for profiling. Note also that we aren't using the -O2 compiler optimization option. This is to make sure that the application generated executes in exactly the same way as we specified in the source file. We can then measure the performance of our own algorithms instead of measuring those optimized by the compiler. Once your application has been recompiled, copy it to your target and run it. The program must run for quite a while to generate meaningful results. Provide your application with as wide a range of input as possible to exercise as much of its code as possible. Upon the application's exit, a gmon.out output file is generated with the profiling data. This file is cross-platform readable and you can therefore use your host's gprof to analyze it. After having copied the gmon.out file back to your application's source directory, use gprof to retrieve the call graph profile data: $ gprof command-daemon This command prints the call graph profile data to the standard output. Redirect this output using the > operator to a file if you like. You don't need to specify the gmon.out file specifically, it is automatically loaded. For more information regarding the use of gprof, see the GNU gprof manual. 11.3.2 Code CoverageIn addition to identifying the time spent in the different parts of your application, it is interesting to count how many times each statement in your application is being executed. This sort of coverage analysis can bring to light code that is never called or code that is called so often that it merits special attention. The most common way to perform coverage analysis is to use a combination of compiler options and the gcov utility. This functionality relies on the gcc library, libgcc, which is compiled at the same time as the gcc compiler. Unfortunately, however, gcc versions earlier than 3.0 don't allow the coverage functions to be compiled into libgcc when they detect that a cross-compiler is being built. In the case of the compiler built in Chapter 4, for example, the libgcc doesn't include the appropriate code to generate data about code coverage. It is therefore impossible to analyze the coverage of a program built against unmodified gcc sources. To build the code needed for coverage analysis in versions of gcc later than 3.0, just configure them with the - -with-headers= option. To circumvent the same problem in gcc versions earlier than 3.0, edit the gcc-2.95.3/gcc/libgcc2.c file, or the equivalent file for your compiler version, and disable the following definition: /* In a cross-compilation situation, default to inhibiting compilation of routines that use libc. */ #if defined(CROSS_COMPILE) && !defined(inhibit_libc) #define inhibit_libc #endif To disable the definition, add #if 0 and #endif around the code so that it looks like this: /* gcc makes the assumption that we don't have glibc for the target, which is wrong in the case of embedded Linux. */ #if 0 /* In a cross-compilation situation, default to inhibiting compilation of routines that use libc. */ #if defined(CROSS_COMPILE) && !defined(inhibit_libc) #define inhibit_libc #endif #endif /* #if 0 */ Now recompile and reinstall gcc as we did in Chapter 4. You don't need to rebuild the bootstrap compiler, since we've already built and installed glibc. Build only the final compiler. Next, modify your applications' Makefiles to use the appropriate compiler options. Here are the portions of the Makefile provided in Chapter 4 that must be changed to build a program that will generate code coverage data: CFLAGS = -Wall -fprofile-arcs -ftest-coverage As we did before when compiling the application to generate profiling data, omit the -O optimization options to obtain the code coverage data that corresponds exactly to your source code. For each source file compiled, you should now have a .bb and .bbg file in the source directory. Copy the program to your target and run it as you would normally. When you run the program, a .da file will be generated for each source file. Unfortunately, however, the .da files are generated using the absolute path to the original source files. Hence, you must create a copy of this path on your target's root filesystem. Though you may not run the binary from that directory, this is where the .da files for your application will be placed. My command daemon, for example, is located in /home/karim/control-project/control-module/project/command-daemon on my host. I had to create that complete path on my target's root filesystem so that the daemon's .da files would be properly created. The -p option of mkdir was quite useful in this case. Once the program is done executing, copy the .da files back to your host and run gcov: $ gcov daemon.c 71.08% of 837 source lines executed in file daemon.c Creating daemon.c.gcov. The .gcov file generated contains the coverage information in a human-readable form. The .da files are architecture-independent, so there's no problem in using the host's gcov to process them. For more information regarding the use of gcov or the output it generates, look at the gcov section of the gcc manual. 11.3.3 System ProfilingEvery Linux system has many processes competing for system resources. Being able to quantify the impact each process has on the system's load is important in trying to build a balanced and responsive system. There are a few basic ways in Linux to quantify the effect the processes have on the system. This section discusses two of these: extracting information from /proc and using LTT. 11.3.3.1 Basic /proc figuresThe /proc filesystem contains virtual entries where the kernel provides information regarding its own internal data structures and the system in general. Some of this information, such as process times, is based on samples collected by the kernel at each clock tick. The traditional package for extracting information from the /proc directory is procps, which includes utilities like ps and top. There are currently two procps packages maintained independently. The first is maintained by Rik van Riel and is available from http://surriel.com/procps/. The second is maintained by Albert Cahalan and is available from http://procps.sourceforge.net/. Though there is an ongoing debate as to which is the "official" procps, both packages contain Makefiles that are not cross-platform development friendly, and neither is therefore fit for use in embedded systems. Instead, use the ps replacement found in BusyBox. Though it doesn't output process statistics as the ps in procps does, it does provide you with basic information regarding the software running on your target: # ps
PID Uid VmSize Stat Command
1 0 820 S init
2 0 S [keventd]
3 0 S [kswapd]
4 0 S [kreclaimd]
5 0 S [bdflush]
6 0 S [kupdated]
7 0 S [mtdblockd]
8 0 S [rpciod]
16 0 816 S -sh
17 0 816 R ps aux
If you find this information insufficient, you can browse /proc manually to retrieve the information you need regarding each process. 11.3.3.2 Complete profile using LTTBecause LTT records crucial system information, it can extract very detailed information regarding the system's behavior. Unlike the information found in /proc, the statistics generated by LTT are not sampled. Rather, they are based on an exact accounting of the time spent by processes inside the kernel. LTT provides two types of statistics: per-process statistics and system statistics. Both are provided in the "Process analysis" thumbnail. The per-process statistics are display by LTT when you select a process in the process tree displayed in the "Process analysis" thumbnail. Figure 11-3 illustrates the data that can be extracted for a single process. Figure 11-3. Single process statistics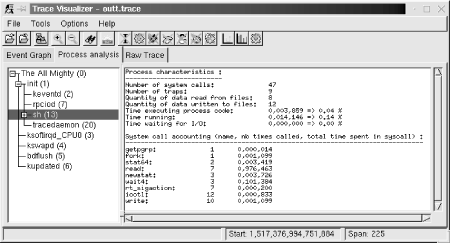 Among other things, the data tells you how much time your task was scheduled by the kernel ("Time running") versus how much time was spent running actual application code ("Time executing process code"). In this case, the task wasn't waiting for any I/O. But if it did, the "Time waiting for I/O" line would give you a measure of how much time was spent waiting. The times and percentages given depend on the time spent tracing. In this case, tracing lasted 10 seconds. LTT also provides information regarding the system calls made by an application. In particular, it gives you the number of times each system call was made and the total time the kernel took to service all these calls. The system-wide statistics are displayed by LTT when you select the topmost process entry in the process tree, which is called "The All Mighty (0)." Figure 11-4 illustrates the system data extracted by LTT. Figure 11-4. Overall system statistics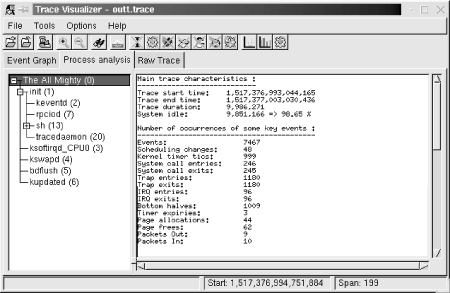 The system statistics start with a few numbers regarding the trace itself. In this case, the trace lasted almost 10 seconds and the system was idle for over 98% of that time. Next, the number of times a few key events have happened are provided. On 7467 events, LTT says that 1180 were traps and 96 were interrupts (with 96 IRQ entries and 96 IRQ exits.) This sort of information can help you pinpoint actual problems with the system's overall behavior. The screen also displays a cumulative summary of the system calls made by the various applications running on the system. As with the actual trace information, the statistics displayed in the "Process analysis" thumbnail can be dumped in text form to file from the command line. Look at the LTT documentation for more information on how this is done. 11.3.4 Kernel ProfilingSometimes the applications are not the root of performance degradation, but are rather suffering from the kernel's own performance problems. In that case, it is necessary to use the right tools to identify the reasons for the kernel's behavior. There are quite a few tools for measuring the kernel's performance. The most famous is probably LMbench (http://www.bitmover.com/lmbench/). LMbench, however, requires a C compiler and the Perl interpreter. It is therefore not well adapted for use in embedded systems. Another tool for measuring kernel performance is kernprof (http://oss.sgi.com/projects/kernprof/). Though it can generate output that can be fed to gprof, it involves the use of a kernel patch and works only for x86, ia64, sparc64, and mips64. As you can see, most embedded architectures are not supported by kernprof. There remains the sample-based profiling functionality built into the kernel. This profiling system works by sampling the instruction pointer on every timer interrupt. It then increments a counter according to the instruction pointer. Over a long period of time, it is expected that the functions where the kernel spends the greatest amount of time will have a higher number of hits than other functions. Though this is a crude kernel profiling method, it is the best one available at this time for most embedded Linux systems. To activate kernel profiling, you must use the profile= boot parameter. The number you provide as a parameter sets the number of bits by which the instruction pointer is shifted to the right before being used as an index into the sample table. The smaller the number, the higher the precision of the samples, but the more memory is necessary for the sample table. The value most often used is 2. The sampling activity itself doesn't slow the kernel down, because it only occurs at each clock tick and because the counter to increment is easily obtained from the value of the instruction pointer at the time of the timer interrupt. Once you've booted a kernel to which you passed the profile= parameter, you will find a new entry in your target's /proc directory, /proc/profile. The kernel's sample table is exported to this /proc entry. To read the profile samples available from /proc/profile, you must use the readprofile utility available as an independent package from http://sourceforge.net/projects/minilop/ or as part of the util-linux package from http://www.kernel.org/pub/linux/utils/util-linux/. In the following explanations, I will cover the independent package only since util-linux includes a lot more utilities than just readprofile. Download the readprofile package and extract it in your ${PRJROOT}/debug directory. Move to the package's directory and compile the utility: $ cd ${PRJROOT}/debug/readprofile-3.0
$ make CC=powerpc-uclibc-gcc
To compile the utility statically, add LDFLAGS="-static" to the make command line. The binary generated is fairly small. When statically linked with uClibc and stripped, for example, it is 30 KB in size. Once readprofile is built, copy it to your target's /usr/bin: $ cp readprofile ${PRJROOT}/rootfs/usr/bin
For readprofile to operate adequately, you must also copy the appropriate System.map kernel map file to your target's root filesystem: $ cp ${PRJROOT}/images/System.map-2.4.18 ${PRJROOT}/rootfs/etc
With your target root filesystem ready, change the kernel boot parameters and add the profile=2 boot parameter. After the system boots, you can run readprofile: # readprofile -m /etc/System.map-2.4.18 > profile.out The profile.out file now contains the profiling information in text form. At any time, you can erase the sample table collected on your target by writing to your target's /proc/profile:[5]
# echo > /proc/profile When done profiling, copy the profile.out file back to your host and have a look at its contents: $ cat profile.out
...
30 _ _save_flags_ptr_end 0.3000
10 _ _sti 0.1250
8 _ _flush_page_to_ram 0.1053
7 clear_page 0.1750
3 copy_page 0.0500
1 m8xx_mask_and_ack 0.0179
2 iopa 0.0263
1 map_page 0.0089
...
1 do_xprt_transmit 0.0010
1 rpc_add_wait_queue 0.0035
1 _ _rpc_sleep_on 0.0016
1 rpc_wake_up_next 0.0068
1 _ _rpc_execute 0.0013
2 rpciod_down 0.0043
15 exit_devpts_fs 0.2885
73678 total 0.0618 0.04%
The left column indicates the number of samples taken at that location, followed by the name of the function where the sample was taken. The third column is a number that provides an approximation of the function's load, which is calculated as a ratio between the number of ticks that occurred in the function and the function's length. See the readprofile manpage included with the package for in-depth details about the utility's output. 11.3.5 Measuring Interrupt LatencyOne of the most important metrics for real-time embedded systems is the time it takes for them to respond to outside events. Such systems, as I explained in Chapter 1, can cause catastrophic results if they do not respond in time. There are a few known ad-hoc techniques for measuring a system's response time to interrupts (more commonly known as interrupt latency). These measurement techniques can be roughly divided into two categories:
In the case of the self-contained method, you must write a small software driver that initiates and handles the interrupt. To initiate the interrupt, the driver does two things:
The driver's interrupt handler, on the other hand, must do the following:
By subtracting the time at which the interrupt was triggered from the time at which the interrupt handler is invoked, you get a figure that is very close to the actual interrupt latency. The reason this figure is not the actual interrupt latency is that you are partly measuring the time it takes for do_gettimeofday( ) and other software to run. Have your driver repeat the operation a number of times to quantify the variations in interrupt latency. To get a better measure of the interrupt latency using the self-contained method, plug an oscilloscope on the output pin toggled by your driver and observe the time it takes for it to be toggled. This number should be slightly smaller than that obtained using do_gettimeofday( ), because the execution of the first call to this function is not included in the oscilloscope output. To get an even better measure of the interrupt latency, remove the calls to do_gettimeofday( ) completely and use only the oscilloscope to measure the time between bit toggles. Though the self-contained method is fine for simple measurements on systems that can actually trigger and handle interrupts simultaneously in this fashion, the induced method is usually the most trusted way to measure interrupt latency, and is closest to the way in which interrupts are actually delivered to the system. If you have a driver that has high latency and contains code that changes the interrupt mask, for example, the interrupt driver for the self-contained method may have to wait until the high latency driver finishes before it can even trigger interrupts. Since the delay for triggering interrupts isn't measured, the self-contained method may fail to measure the worst-case impact of the high latency driver. The induced method, however, would not fail, since the interrupt's trigger source does not depend on the system being measured. The software driver for the induced method is much simpler to write than that for the self-contained method. Basically, your driver has to implement an interrupt handler to toggle the state of one of the system's output pins. By plotting the system's response along with the square wave generated by the frequency generator, you can measure the exact time it takes for the system to respond to interrupts. Instead of an oscilloscope, you could use a simple counter circuit that counts the difference between the interrupt trigger and the target's response. The circuit would be reset by the interrupt trigger and would stop counting when receiving the target's response. You could also use another system whose only task is to measure the time difference between the interrupt trigger and the target's response. However efficient the self-contained and the induced methods or any of their variants may be, Linux is not a real-time operating system. Hence, though you may observe steady interrupt latencies when the system is idle, Linux's response time will vary greatly whenever its processing load increases. Simply increase your target's processing load by typing ls -R / on your target while conducting interrupt latency tests and look at the flickering oscilloscope output to observe this effect. One approach you may want to try is to measure interrupt latency while the system is at its peak load. This yields the maximum interrupt latency on your target. This latency may, however, be unacceptable for your application. If you need to have absolute bare-minimum bounded interrupt latency, you may want to consider using one of the real-time derivatives mentioned in Chapter 1. |
|
|
|