| [ Team LiB ] |
|
Using a DebuggerWhen you're working with a program that isn't behaving properly, you need to examine the state of the program while it is running. If it's not too complicated, it's possible to dump the state using any of the methods discussed earlier. However, if the state is complex or if you need to monitor changes in state or watch events that initiate transitions, a debugger is often the only way to do it. There are many different kinds of debuggers for Java. The JDK comes with a command-line debugger called jdb. Many people find jdb painful to use because it isn't a graphical debugger, as you would find in an Interactive Development Environment. Many times, however, you're working on a server in which you might not have access to a graphical environment anyway. When you have a lot of machines stored away in a machine room somewhere and you can't use the X Window system because of firewall restrictions, you might need to resort to using Telnet to access the machines. If you're using Telnet, jdb is probably your best bet. Use VNC for Remote Access
In general, there are two ways to debug a Java program: Start the program from a debugger, or run the Java program with remote debugging enabled and attach a debugger to the program. The advantage of remote debugging is that you don't need to figure out what class to run at startup. You let the server go through its normal startup and then attach the debugger and start running. However, it's also generally more complicated and error-prone. Debugging a Servlet with Tomcat Using jdbThe jdb debugger enables you to step through code one line at a time and also display the value of variables. To debug a Java program, use the jdb command just as you would use the java command. For example, to debug a class called HelloWorld, type jdb HelloWorld Here, jdb is being used to debug a program locally. You can debug servlets running under the control of Tomcat the same way. Tomcat normally requires a number of options for the java command, so you might think that it would be difficult to start Tomcat under jdb. Fortunately, the catalina script (catalina.bat on Windows, catalina.sh on Unix/Linux) can start Tomcat under jdb automatically. To start Tomcat under jdb on Windows, type catalina debug To start Tomcat under jdb on Unix/Linux, type catalina.sh debug startup.sh or catalina.sh?
To debug a servlet like HelloWorldServlet, just tell jdb to stop in the servlet's doGet method, like this: stop in examples.HelloWorldServlet.doGet Setting Breakpoints on Overloaded Methods
Then, in order to start Tomcat, simply issue the command run When you access the servlet, the debugger notifies you that a thread has reached the breakpoint, as you can see in Figure 11.3. Figure 11.3. The debugger tells you when a thread hits a breakpoint.
You can use the list command to see the current line in the source code, but first you must tell jdb where to find the source code. Give jdb the path to your source code, like this: use /home/tyjsp20/ Most Java debuggers expect the source code to have the same directory structure as the classes. For example, because HelloWorldServlet is in a package named examples, jdb looks for HelloWorldServlet.java in /home/tyjsp20/examples/. Notice that it appends the package structure to the path you provided earlier. Setting up the proper directories is the biggest hurdle new developers must face when learning to debug with tools. After you have the source path set up, if you type list, you should see something like the screen shown in Figure 11.4. Figure 11.4. The Java Debugger can show you the source code that is executing.
The Java Debugger has many commands and includes some online help, which you can get by typing help or just ?. Use the cont command to send control back to the program you're debugging and quit to exit. By attaching to a server, you can use jdb to debug remotely. If you're working in a distributed environment, where Tomcat is hosted on a machine other than your workstation, you can start Tomcat on the server using the command catalina.sh jpda start This causes Tomcat to run in a JVM that supports debugging using the Java Platform Debugging Architecture (JPDA), which is what makes it possible to debug over-the-wire. Then, at your workstation, you simply issue the command jdb -connect com.sun.jdi.SocketAttach:hostname=HOSTNAME,port=8000 Be certain to replace HOSTNAME with the actual name of the server running Tomcat. You'll see the same prompt you saw before and can debug in the same way. The only difference is that you will not need to issue the command run, since Tomcat will already be running. Any debugger that supports JPDA should be able to debug servlets running inside Tomcat. Using a Graphical Debugger with TomcatSeveral excellent Integrated Development Environments (IDE) and stand-alone debuggers exist that can help you debug problems efficiently. Here is a list of a few of them that are freely available:
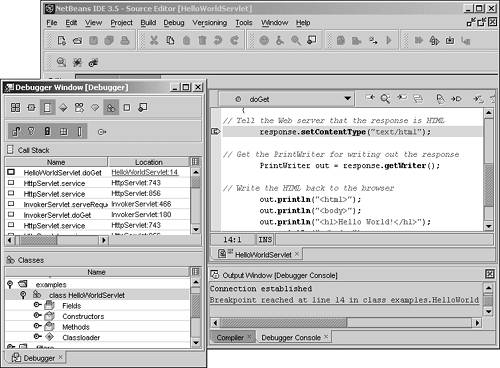
Although the debuggers vary in the set of features they provide and in the way you use them, there are some common elements when it comes to working with servlets and JSPs. Generally, debugging begins by identifying or creating a project or session through which you identify the location of the source files and classes. Most of these tools integrate nicely with Tomcat when the tool and Tomcat are hosted on the same machine. They are often able to start and stop Tomcat and may also be able to deploy (or redeploy) Web applications or components. With JDK 1.4, some of the tools are even able to "hot-swap" classes, allowing you to change your source, back up to a point prior to your changes, and start debugging again. All of the debuggers are JPDA compatible. Like jdb, you simply need to start Tomcat with JPDA enabled and tell the debugger the address of the machine that is hosting Tomcat. As you saw earlier, you only need to provide a path to the source code for the debugger to provide you with a listing. Figure 11.5 shows a debugging session in Netbeans. Figure 11.5. The Netbeans Debugger presents a global view of the application.
You can see that there's quite a bit of information that Netbeans provides. It will give you a view into the source code and identify the particular line that is currently executing. It also traces the flow of methods and shows you variables that are in scope. Like jdb, you can insert breakpoints and manage the execution state. If you have an environment that can support them, GUI debuggers are often easier to use and can give you a snapshot that is very useful while trouble shooting an application. Debugging a JavaServer Page with TomcatBecause JavaServer Pages eventually become servlets, you can debug a JSP by following the same procedure you use to debug servletswith a few extra steps. When Tomcat translates a JSP into a servlet, it puts the generated servlet code and classes into the work directory underneath the main Tomcat directory. This is where you need to look for a JSP's servlet. If you take a minute to look at this directory in your Tomcat installation, you'll see that there's a Catalina/localhost/ subdirectory under the work/ directory. Then, you may have noticed that there are directories for each application context. One, the root context, is identified by a simple underscore (_). Following the directory that corresponds to the application context in which you are debugging, you'll find the familiar hierarchy of directories used with packages. The default package for JSPs is org.apache.jsp, so the full path to the code and classes for a simple JSP is <TOMACT_HOME>/work/Catalina/localhost/_/org/apache/jsp Debugging and Tomcat 5
Having located the source file, you need to let your debugger know where it is. When the debugger is integrated with Tomcat, it often already knows this. In some cases, particularly when doing remote debugging, the source file is synchronized to a local directory. Developers can also mount directories for local use. Although it's nice to be able to get under the hood, it probably seems like a little much to expect JSP developers to be experts at debugging servlets. After all, JSPs are supposed to make Web application development easier, right? Several IDEs make it possible to locally debug JSPs using only JSP source files. Figure 11.6 shows another debugging session using Netbeansthis time directly debugging a JavaServer Page. Figure 11.6. The Netbeans Debugger can also debug JSPs directly.
Most debuggers that can do this use proprietary methods. The JSP 2.0 specification introduces standardized support for debugging in other languages, including JSP itself. |
| [ Team LiB ] |
|