Hack 53. Probe HTML with the DOM Inspector
Mozilla's powerful DOM Inspector tool deconstructs web pages for your benefit. The standard Firefox install comes complete with the optional DOM Inspector tool. This tool gives web developers and Mozilla programmers a microscope that can be used to examine HTML and XML documents after they're displayed. This hack shows how to analyze an HTML page with it. You can also use it to analyze XUL pages [Hack #76] . In this hack, we'll work with the following web page content: <html>
<head>
<style>
.header { font-family : Arial; }
</style>
<script>
function click_handler( ) {
alert("Click");
}
</script>
</head>
<body>
<h3 class="header">Test Page</h3>
<script>
document.write("<p>Hello, World!</p>");
</script>
<p id="link-para">
<a href="about:blank" onclick="click_handler( )">A Link</a>
</p>
</body>
</html>5.11.1. Inspecting a PageThe DOM Inspector can be a tricky little tool to coordinate with your web page. There are several ways to start it up:
The formatting and indenting of our sample page results in lots of
extra W3C DOM 1 Core Text Nodes being added to the document when
it's displayed. In most cases, and to match the
screenshots in this hack, you should filter out that separator
content for convenience. To do so, just pick View <html><head><style> .header { font-family : Arial; } </style><script>
function click_handler( ) { alert("Click"); } </script></head><body>
<h3 class="header">Test Page</h3><script> document.write("<p>
Hello, World!</p>"); </script><p id="link-para">
<a href="about:blank" onclick="click_handler( )">A Link</a></p>
</body></html>You can open several DOM Inspector windows if you want. If the window
or pane that displays the target web page ever goes away, the DOM
Inspector will stop working. If that happens, close down the DOM
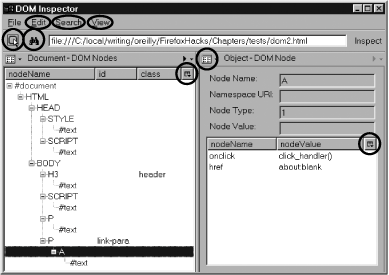
Inspector and restart it. The File 5.11.2. Deconstructing a PageFigure 5-10 shows the page as the DOM Inspector sees it, with the tree of DOM 1 Core Nodes in the left pane fully expanded to show detail. The highlighted items are things that are safe to click once the page is displayed. Figure 5-10. DOM Inspector view of a target web page Let's first look at the left pane. Notice how the <script> element in the body appears in its original form; such elements are usually static content of the page. Notice also how the content generated by document.write() (the first <p> element) also appears in the tag hierarchy. The DOM Inspector displays the living state of the page, not just the content of the source HTML document. The right pane displays the tag attributes for the selected <a> element. In this case, the pane displays tag attributes, but that can be changed with the drop-down menu in the top-right corner of the page. The two most useful options in that menu are CSS Style Rules and Computed Style. Unlike other tools, such as the Web Developer Toolbar, the DOM Inspector display can be used to report the state of every CSS and Mozilla property that might apply to a given element. If the HTML document is big, use the Search 5.11.3. Hacking a Page to BitsThe DOM Inspector is a read/write tool. You can cut, copy, paste, insert, delete, or update nodes in the target page in a permanent way. That's more powerful than just applying display: none styles to existing content. To do so, just display a target page as in the previous section, select an item in the tree of nodes in the left pane, and then click in any of these places to see the set of operations you can apply:
Make any such change and the window displaying your target HTML document changes to match. Any changes that you make like this will survive until the target page is reloaded. Cut, copy, and paste operations cannot deliver content to other applications via the desktop clipboard. Only the Copy XML operation can do that. |