| [ Team LiB ] |
|
WebLogic Server TuningWebLogic Server can handle a large number of simultaneous clients through the use of threads and queues. As shown in Figure 25.7, a client request comes in on a port being serviced by WebLogic Server. An available socket thread then reads the request and places it on the execute queue. When an execute thread becomes available, it reads the request and performs the desired action within the WebLogic application. WebLogic Server includes options to change the behavior of these threads and queues. Figure 25.7. Client requests must be handled by a socket reader thread and an execute thread before reaching the WebLogic application.
WebLogic Server Performance PacksWebLogic Server performance packs allow WebLogic to use native platform-optimized sockets rather than Java socket readers, which improves performance tremendously. The BEA WebLogic Server certifications list details which platforms have performance packs available. If you are using a performance pack, make sure that it is enabled in the config.xml file with the statement: NativeIOEnabled=true. The default config.xml that ships with WebLogic Server contains this statement. This value can also be set on the Tuning tab in the Server Configuration page in the Administration Console. As shown in Figure 25.8, make sure that the Enable Native IO check box is enabled to use the performance pack. Figure 25.8. The Administration Console can be used to modify the percentage of execute threads to use as socket readers.
If you are not using a performance pack, a percentage of execute threads must be allocated to act as socket readers. The default is 33%, but the percentage can be set between 1% and 99%. When setting this value, it is important to balance the number of socket reader threads and execute queue threads so that client requests are accepted and are executed efficiently. This value can be modified in the Administration Console, as shown in Figure 25.8. The Default Queues and Execute ThreadsBy default, WebLogic Server starts with one default execute queue serviced by 15 execute threads. When all of these threads are busy, client requests will remain in the execute queue. In some circumstances, adding more execute threads increases performance of WebLogic applications. However, because each CPU within a machine can execute only one thread at a time, having too many threads can actually decrease performance because of thrashing. Thrashing occurs when more time is spent switching between threads and maintaining the thread pool than actually servicing client requests. If the execute queue is filling up with requests and the CPU of the machine running WebLogic Server has not reached 100%, the execute thread count should be increased. This situation can occur when execute threads are waiting on external resources such as database requests or network bandwidth. The number of requests waiting on the execute queue and oldest pending request can be monitored from the Administration Console as shown in Figure 25.5. The optimal number of execute threads depends on many factors, including hardware platform, operating system, choice of JVM, and the WebLogic applications that are executing. It is prudent to experiment with the number of execute threads when CPU utilization is less than 100%. Another thing to keep in mind is that the maximum number of simultaneous JDBC connections from WebLogic is the number of execute threads minus one. That means if there are fewer execute threads than JDBC connections in a JDBC connection pool, all the connections could never be used simultaneously. Chances are that this is not the behavior you are looking for. The number of execute threads can be changed on a server-to-server basis from the Administration Console, as shown in Figure 25.9. To get to the page, click the server name in the left panel and then click the Monitoring and General tabs in the right panel. Click on the Monitor All Active Queues link. This will display all of that server's execute queues. In addition to the default queue, WebLogic Server also creates dedicated queues for distributed garbage collection and for communication with the Administrative Console using HTML and RMI. From the Configuration tab, click on the default queue. This will display the current activity of the execute threads. Click on the Configure Execute Queue link and then click on the default link. After you change the thread count, you will need to restart WebLogic Server. Figure 25.9. The number of execute threads can be modified from the Administration Console.
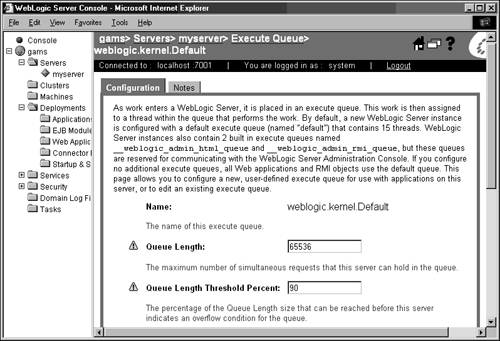
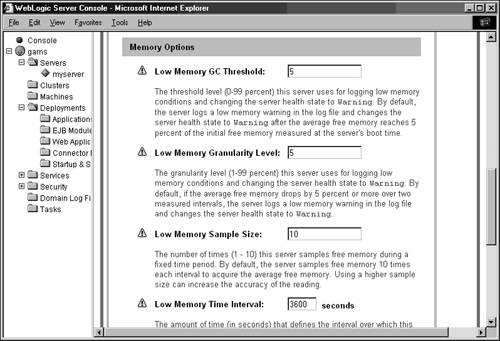
Handling Overflow ConditionsDetermining the optimal number of execute threads is an important step in tuning WebLogic applications under normal conditions. WebLogic Server also allows thread counts to change when applications are running under peak conditions in order to accommodate additional client requests. An error message is logged when a threshold is crossed. This threshold is a percentage of the total number of threads in use or not available to handle client requests because they are considered stuck. The overflow condition can then be used to create additional threads, if desired. As shown in Figure 25.9 and explained in Table 25.2, several parameters can be modified in association with thread count. Keep in mind that additional threads will remain in use even when peak usage for the application has ended. If the thread count was optimized previously under normal conditions, the extra threads will decrease performance over time. For this reason, the parameters in Table 25.2 should not be used for tuning; they are merely a mechanism for dealing with abnormal conditions. Instead, check the log for overflow errors and adjust the actual thread count as a substitute for relying on the threads increase parameter as tuning parameter. Additional Execute QueuesThe default execute queue and its associated threads are general purpose and will service all client requests directed toward the Web and EJB containers. Your WebLogic application might contain certain servlets, JSPs, and EJB that are deemed to be much more critical than the rest of the application. This could be functionality that will be utilized by senior management, such as the generation of profit and loss reports. If this is the case, you can create a specific queue to service the application components that implement the critical functionality. The execute threads that service this queue will not have to compete with threads that service the default queue and the performance of critical functionality will be more insulated from the rest of the WebLogic application. Conversely, general application functionality can be assigned to a special queue to limit the effect of regular or perhaps nonpaying customers. For example, imagine a WebLogic application that represents an online brokerage where any guest can check stock prices, but only paying customers can buy and sell securities. If too many people are checking stock prices, it could negatively affect the paying customers' experience. We can set up a special queue for browsing stock prices and limit the number of threads associated with it. In this way, our guests will experience delays before our paying customers will. New execute queue are created from the administration console on a server-by-server basis. Click on the server name in the left pane and then the Monitoring and General tabs in the right pane. Click on the Monitor all Active Queues link, click the Configure Execute Queue link, and then click the Configure a New Execute Queue link. You will now see a page similar to the one shown in Figure 25.9. Enter queue information and click the Create button. You will need to restart WebLogic Server for this new execute queue to be created. Assigning servlets and JSPs to the execute queue is accomplished by entering the queue name as the value of the wl-dispatch-policy parameter in web.xml, as shown in Listing 25.2. Listing 25.2 Excerpt from web.xml<servlet> <servlet-name>SpecialServlet</servlet-name> <jsp-file>/gams/showFeeReport.jsp</jsp-file> <init-param> <param-name>wl-dispatch-policy</param-name> <param-value>SpecialQueue</param-value> </init-param> </servlet> Assigning EJBs and RMI objects to an execute queue is accomplished by using the dispatchPolicy option with the RMIC or EJBC compilers. Backlog ConnectionsAs shown in Figure 25.7, client requests must wait for a socket reader thread before being placed on an execute queue. By default, the maximum number of waiting client requests allowed is 50. When the number of waiting requests reaches that amount, WebLogic Server will refuse new connections. To accommodate more client requests, the client request backlog can be increased. This value can be changed from the Tuning tab, as was shown in Figure 25.8. Keep in mind that this will consume more memory within WebLogic Server. Automatically Detect Low Memory ConditionsIn addition to the JVM performing garbage collection, WebLogic Server can be set to detect low memory situations and force garbage collection on a server-by-server basis as shown in Figure 25.10 and explained in Table 25.3. Figure 25.10. WebLogic Server memory configuration options can be viewed and modified with the Administration Console.
Detecting Stuck ThreadsWebLogic Server can detect when threads have not completed their assigned task within a certain amount of time. These threads are marked as stuck and a log entry is created. As explained in Table 25.4, there are two parameters associated with stuck threads. When all threads in the default queue are considered stuck, WebLogic Server can no longer service client requests. Periodically check the log file for stuck threads and correct the architecture of your application to prevent them from reoccurring. You might want to reduce the detection of stuck threads from the default of 10 minutes to a value more suitable to your application. In this way, problems can be detected and corrected sooner.
Choosing a Faster Java CompilerBy default, WebLogic Server uses the standard javac Java compiler found within your JAVA_HOME directory to compile JSP Servlet files. This will typically be Sun's JDK or BEA's JRockit, depending on how your application is configured. Other compilers such as SJ or Jikes might compile significantly faster; you'll need to try them out to see which yields the best performance. From the Administration Console's General Configuration tab, you can set the JSP servlet compiler. This is shown in Figure 25.11. Be sure to add the required JAR files in the Append to Classpath parameter. Figure 25.11. WebLogic Server can use a different compiler for JSP servlet files to improve performance.
The JSP servlet compiler can also be specified in a WebLogic application's weblogic.xml file. Use the -compileCommand and -precompile parameters to specify the compiler and whether to precompile the JSP servlet file when WebLogic Server is started. The weblogic.ejbc utility, which generates EJB container classes, uses the standard Java compiler as well. When executing this utility, use the -compiler parameter to use a different compiler. Using Production ModeDuring development, auto-deployment allows developers to copy whole applications or individual J2EE components to the WebLogic Server domain directory. WebLogic Server will automatically detect and execute these new applications and components. However, auto-deployment consumes resources because WebLogic Server must continually check auto-deployment directories for changes. Make sure that WebLogic Server is started in production mode when your applications are running live. By default, WebLogic Server runs in development mode. To have it run in production mode, add -Dweblogic.ProductionModeEnabled=true to the batch file or command line that starts WebLogic Server. Log File SizesWebLogic Server supports multiple types of log files. When using WebLogic Server as a Web server, the HTTP log tracks every HTTP GET and POST request made to a WebLogic Server domain. This log file can be analyzed and important statistics, such as number of visitors and page views per day, can be extracted from it. By default, this HTTP log will grow in size indefinitely. As the file gets larger, more resources are required to update it. As shown in Figure 25.12, the size of the HTTP log file can be restricted by creating a new log file on a chronological basis (called rotation) or when the log file reaches a certain size. If you are using an external Web server, be sure to set HTTP log rotation parameters suitably. Figure 25.12. WebLogic Server offers many settings to reduce the size of HTTP log files.
Although the WebLogic Server domain log takes a long time to become large and unwieldy, by default, there is no rotation set on it and it will grow indefinitely as well. In the Administration Console, click on the domain name in the left panel, and then click on the Logging and Server tabs in the right panel. Set the rotation parameters as shown in Figure 25.13. The server domain log should be set to rotate. Figure 25.13. WebLogic Server offers many settings to reduce the size of domain log files.
Using WebLogic Server ClusteringWhen you have exhausted all the resources of a single instance of WebLogic Server and have tuned the JVM, the operating system, and your application, the only way to improve performance is to cluster two of more instances of WebLogic Server. This situation occurs when the CPU of your single instance is at or near 100% and adding execute threads does not improve performance. WebLogic Server can work with a dedicated load balancer or a supported Web server can be retrofitted with a WebLogic Server supplied plug-in that acts as a load balancer. WebLogic Server 8.1 supplies load-balancing plug-ins for Netscape Enterprise Server, Apache Server, and Microsoft Internet Information Server. It also includes in own HttpClusterServlet when using a WebLogic instance to act as a load balancer. Almost all J2EE components can be load balanced in a cluster, including HTTP sessions, EJBs and RMI objects, JMS destinations, and JDBC connection pools. For more information about setting up and using WebLogic Server clusters, please see Chapter 36, "Installing, Configuring, and Deploying WebLogic Server Clusters." |
| [ Team LiB ] |
|