[ Team LiB ] Previous Section Next Section

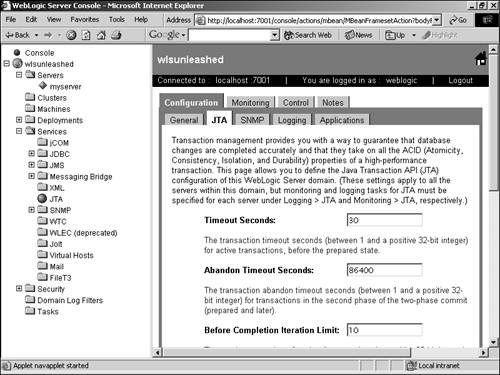
JTA Properties in the Administration Console

The Administration Console is an excellent tool with which you can dynamically configure and monitor your transactions in real-time. In this section, we examine some of the more remarkable features of JTA management through the Administration Console.

Transaction Configuration

The Administration Console enables you to define defaults for transaction timeouts, limits, and transaction manager behavior. The default behavior can be overridden by settings in the weblogic-ejb-jar.xml file or programmatically. Let's take a look at the JTA page in the Administration Console. If you haven't already done so, start WebLogic Server and log in to the Administration Console.

Click on the JTA icon in the left panel to display the Transaction Management page of the Administration Console, as shown in Figure 9.1. It's here that you'll turn when you want to change transaction management settings.

Figure 9.1. The JTA Management page.

graphics/09fig01.jpg

Let's take a look at each of the configurable fields and see what each one does:
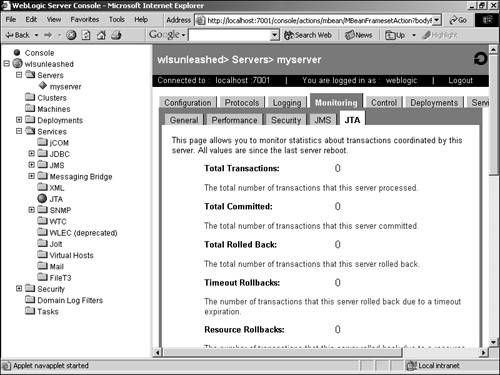
  • Timeout Seconds— The first field shows the time (in seconds) in which a transaction will timeout if uncommitted (default = 30 seconds).

  • Abandon Timeout Seconds— Determines the transaction abandon timeout in seconds (default = 86400 seconds [24 hours]).

  • Before Completion Iteration Limit— Sets the maximum number of cycles the transaction manager will call the beforeCompletion method on the Synchronization interface. beforeCompletion is a callback method called by the transaction manager at the start of the completion process (default = 10 seconds).

  • Max Transactions— The maximum number of simultaneous, in progress, transactions allowed to run on a server at any given time (default = 10000 transactions).

  • Max Unique Name Statistics— The maximum number of unique transaction names allowed for which statistics will be maintained (default = 1000 names).

  • Checkpoint Interval Seconds— The interval at which the transaction manager creates a new transaction log file and checks all old transaction log files to see whether they're ready to be deleted (default = 300 seconds; minimum = 10 seconds; maximum = 1800 seconds).

  • Forget Heuristics— Returns a Boolean indicating whether the transaction manager automatically performs a forget operation on the XAResource interface for transaction heuristic completions (default checked = true). By unchecking the box, context information for heuristic completions is saved and written to the server log. This can be helpful in resolving resource manager data inconsistencies.

Transaction Monitoring

WebLogic provides real-time transaction monitoring through the Administration Console. To access the Transaction Monitoring page, perform the following steps:

  1. Start WebLogic Server for the domain that you want to monitor.

  2. Log on to the Administration Console.

  3. In the left panel, click the Servers icon to display all configured servers in the domain. Click on the server in which you want to monitor JTA.

  4. In the right panel, first click on the Monitoring tab and then on the JTA tab. The JTA Monitoring page is displayed, as in Figure 9.2.

    Figure 9.2. The Transaction Monitoring page.

    graphics/09fig02.jpg

The Transaction Monitoring page is a useful tool to see how your transactions are performing in the real world. It's also a good place to start debugging if there are problems. Let's take a look at some of the Transaction Monitoring fields and see what they mean:

  • Total Transactions— The total number of transactions processed (includes committed, rolled back, and heuristic completions).

  • Total Committed— The total number of committed transactions.

  • Total Rolled Back— The total number of rolled back transactions.

  • Timeout Rollbacks— The total number of transactions that were rolled back because the transaction Timeout Seconds expiration setting was reached.

  • Resource Rollbacks— The total number of transactions that were rolled back because of a resource error.

  • Application Rollbacks— The total number of transactions that were rolled back because of a application error.

  • System Rollbacks— The total number of transactions that were rolled back because of an internal system error.

  • Total Heuristics— The total number of transactions that completed with a heuristic status.

  • Transaction Abandon Total Count— The total number of transactions that were abandoned.

  • Average Commit Time— The average time, in milliseconds, for your transactions to complete.

You can also click on the links at the bottom of the page to monitor transactions by name or by resource, and inflight transactions (transactions that are in progress, but have not yet been committed).

Transaction Logging

Log files are another useful tool to see how your transactions are performing, and also a good place to debug if there are problems. They are the physical representation of the internal state of the transaction manager. Deleting a log file can cause the transaction manager to fail. These files must be backed up like the rest of the configuration files. If you're using a replication tool to keep a backup computer up-to-date, log files must be replicated, too. In case of a server failure, if you want to use the backup server, the transaction logs are necessary for the normal processing to go on.

Transaction logging is configured through the Administration Console.

To access the JTA Log File Configuration page, do the following:

  1. Start WebLogic Server for the domain that you want to monitor.

  2. Log on to the Administration Console.

  3. In the left panel, click the Servers icon to display all configured servers in the domain. Click on the server in which you want to monitor JTA.

  4. In the right panel, first click on the Logging tab, and then on the JTA tab. The JTA Log File Configuration page is displayed as shown in Figure 9.3.

    Figure 9.3. The Transaction Log File Configuration page.

    graphics/09fig03.gif

Your JTA transaction Log files are normally written out to the root directory of your server, such as


C:/bea/user_projects/mydomain/myserver/myserver.0001.tlog

The Transaction Log File Configuration page enables you to configure a different pathname and prefix for the server's transaction log file output. The pathname is not absolute, and assumes the path entered to be relative to the root of the directory of the machine on which the server is running. For instance, if you enter the prefix ./Sunday/jun3002, your JTA log files will create a subdirectory /Sunday, and add the jun3002 prefix string to the front of your JTA log files, to be created as C:/bea/user_projects/mydomain/myserver/Sunday/jun3002myserver.0000.tlog

where myserver is the name of your domain server. This can help keep your JTA log files organized when debugging.

    [ Team LiB ] Previous Section Next Section